
Welcome to Our Blog!
Enjoy expert insights, best practices, and latest updates for Elasticsearch and OpenSearch

Stay Updated with Elasticsearch & OpenSearch Insights
Get expert tips for making Elasticsearch and OpenSearch more efficient and easier to manage, delivered to your inbox.

PostgreSQL Indexes Under the Hood: Pages, Tuples, and B-Trees
How PostgreSQL actually stores rows and builds B-tree indexes - page layout, MVCC visibility, tree fanout, and reading a live index with pageinspect.

Diagnosing High CPU and Memory Pressure on a ClickHouse Node
A systematic walkthrough for tracing a pegged ClickHouse node back to its cause: background merges, memory-bound aggregations, or thread pool misconfiguration.

ClickHouse Materialized Views Explained: Why They're Insert Triggers, Not Stored Queries
A ClickHouse materialized view is an insert trigger, not a stored query — it misses existing data, ignores UPDATE/DELETE, and can duplicate rows on retry.

ClickHouse Joins: What Actually Changed
ClickHouse's reputation for weak JOIN support is a few years out of date. Here's what changed under the hood, with real settings and a runnable example.

Inside ClickHouse MergeTree: Parts, Merges, and Why Inserts Get Throttled
How MergeTree stores data as immutable parts, why background merges eat CPU and IO, and the exact mechanism behind ClickHouse's too-many-parts error.
NeverBlink Announces Support for ClickHouse
NeverBlink, the AI DBA, now supports ClickHouse: detection of silent failures, root-cause analysis with the fix attached, query analytics, schema reviews, and 24/7 expert support.

ClickHouse vs Elasticsearch for Logs: Picking the Right Tool, Not the Trendy One
When ClickHouse beats Elasticsearch for logs, when it doesn't, and why the right answer depends on your query pattern, not the migration trend.
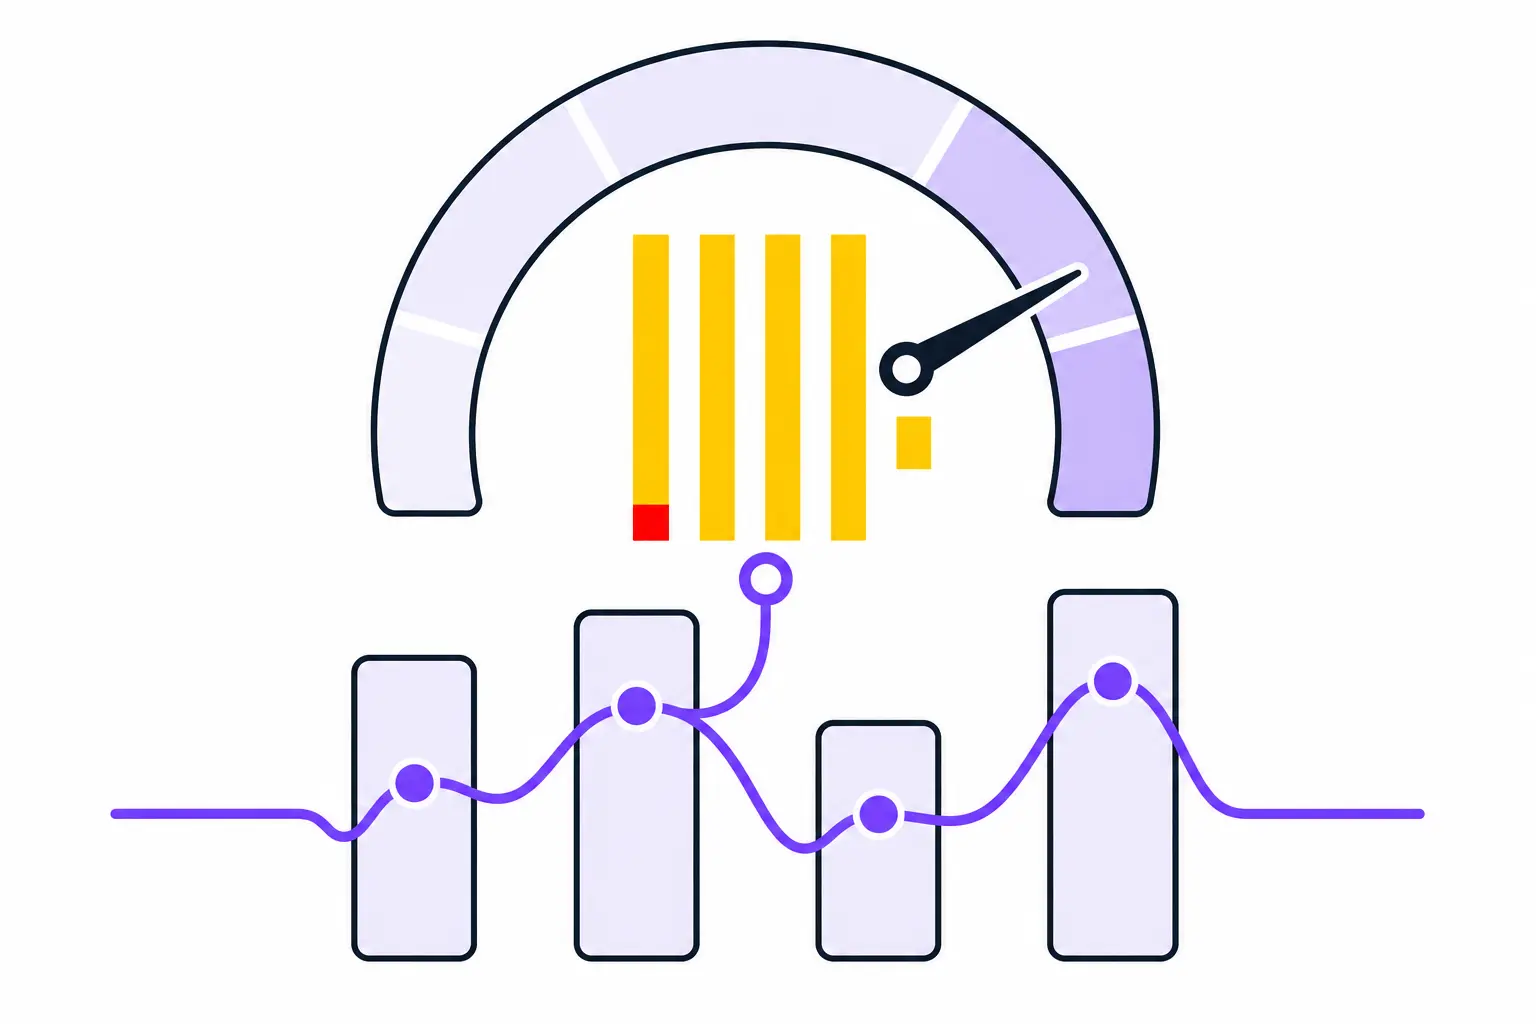
ClickHouse Monitoring: Metrics That Matter
The ClickHouse metrics worth alerting on - part counts, replication lag, memory, host and Keeper health, S3 cache hit rate - with system table sources and thresholds.
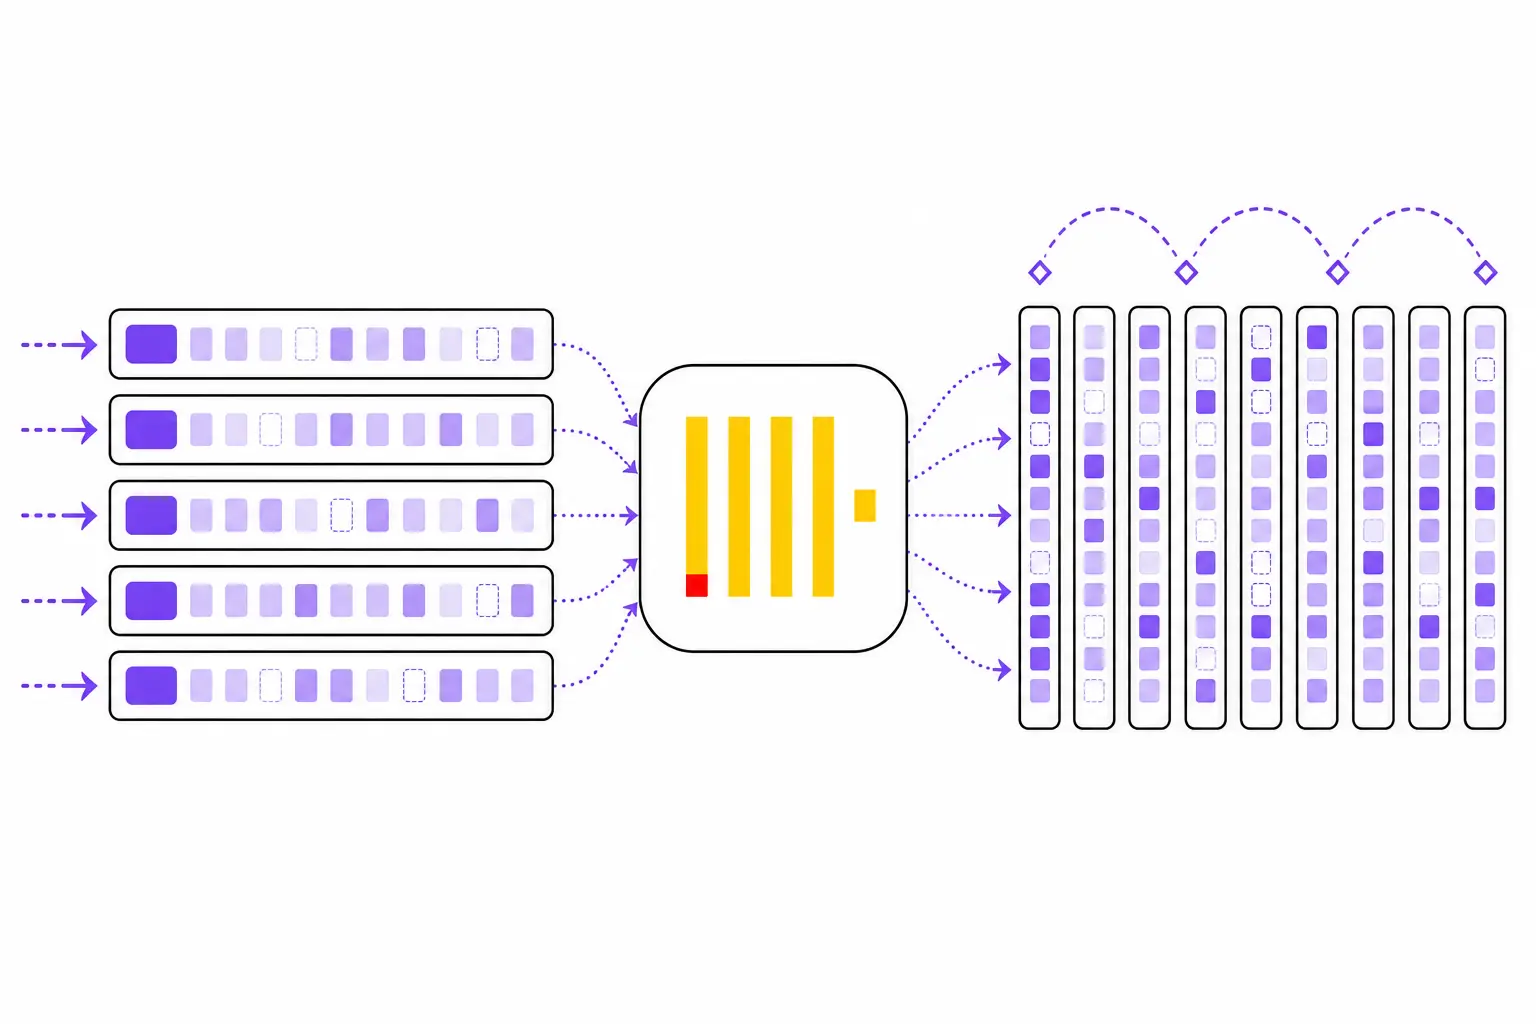
ClickHouse for Observability: Why the Data Shape Picks the Database
Telemetry is append-only wide events queried by aggregation. That shape is exactly what ClickHouse's columnar storage, codecs, and sparse index are built for.
Pulse Is Now NeverBlink AI: Reshaping Database Maintenance
Pulse is now NeverBlink. We're expanding beyond Elasticsearch and OpenSearch and building a proactive, AI-native approach to database maintenance.
Database Reliability Engineer vs. Site Reliability Engineer: What's the Difference?
SRE and DBRE share a philosophy but own different parts of the stack. What actually separates the two roles, where they overlap, and when to hire each.
What Is a Database Reliability Engineer (DBRE) — and Why You Probably Can't Hire One
The book that invented the DBRE role also predicted most companies would never staff it — and prescribed the fix. Here's the buried quote, the scarcity math, and why the prescription is finally buildable in 2026.
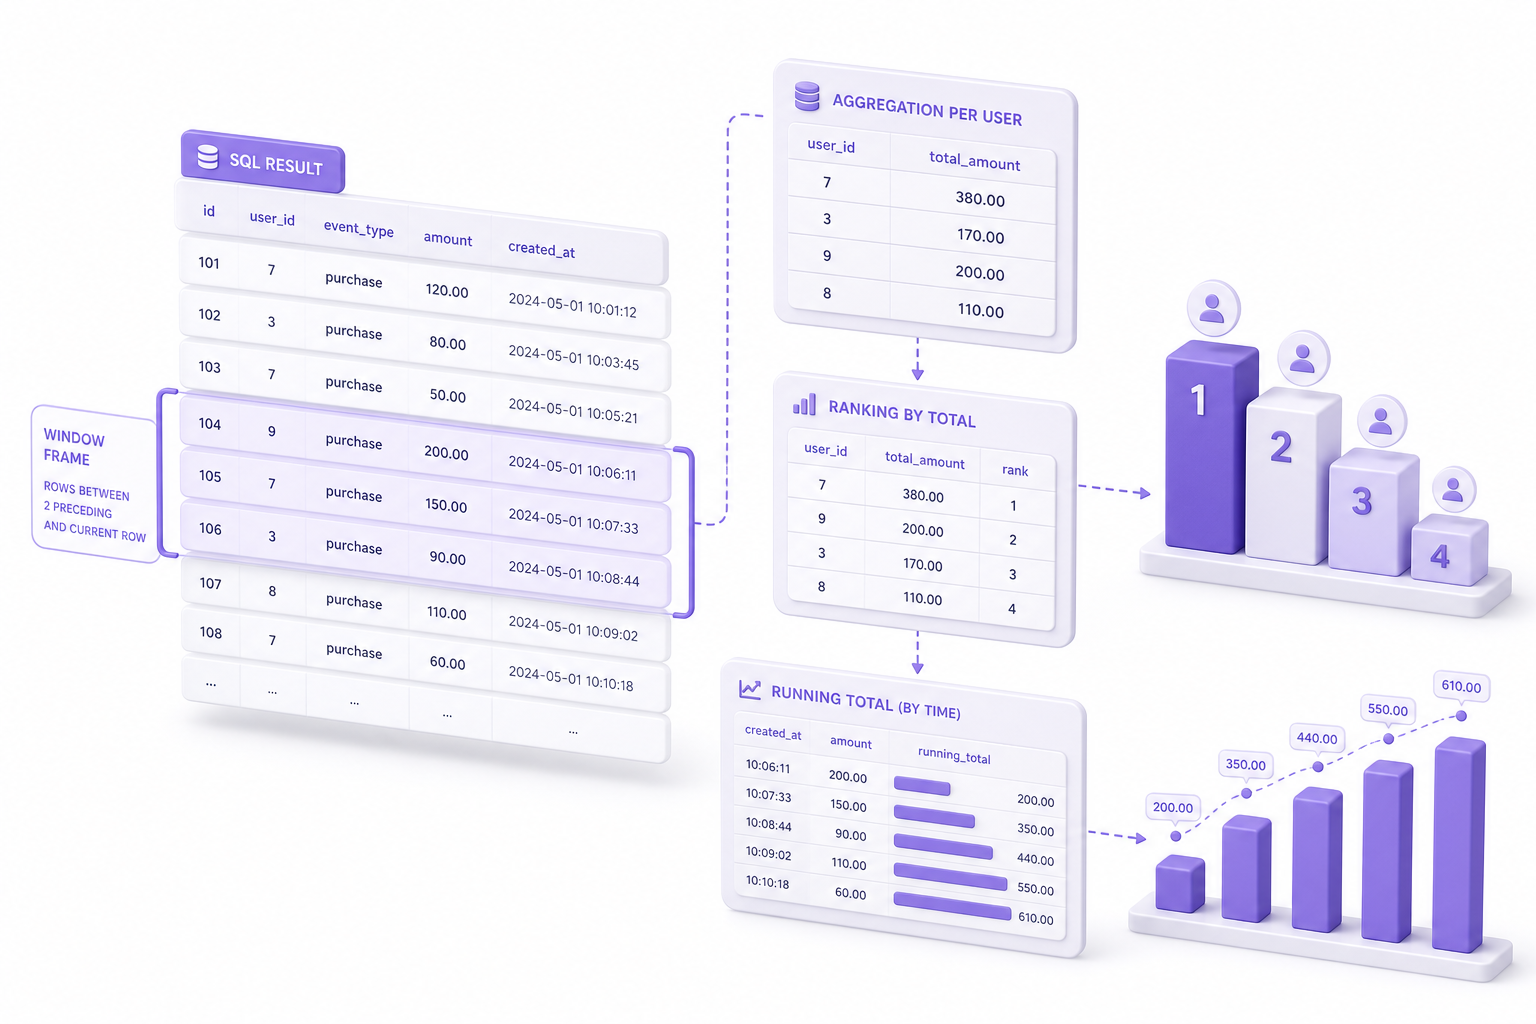
SQL Window Functions and CTEs: Writing Readable, Fast Queries
A practical guide to Common Table Expressions and window functions in PostgreSQL - using WITH for readable and recursive queries, and OVER/PARTITION BY/frame clauses for ranking, running totals, and row-to-row differences without self-joins.
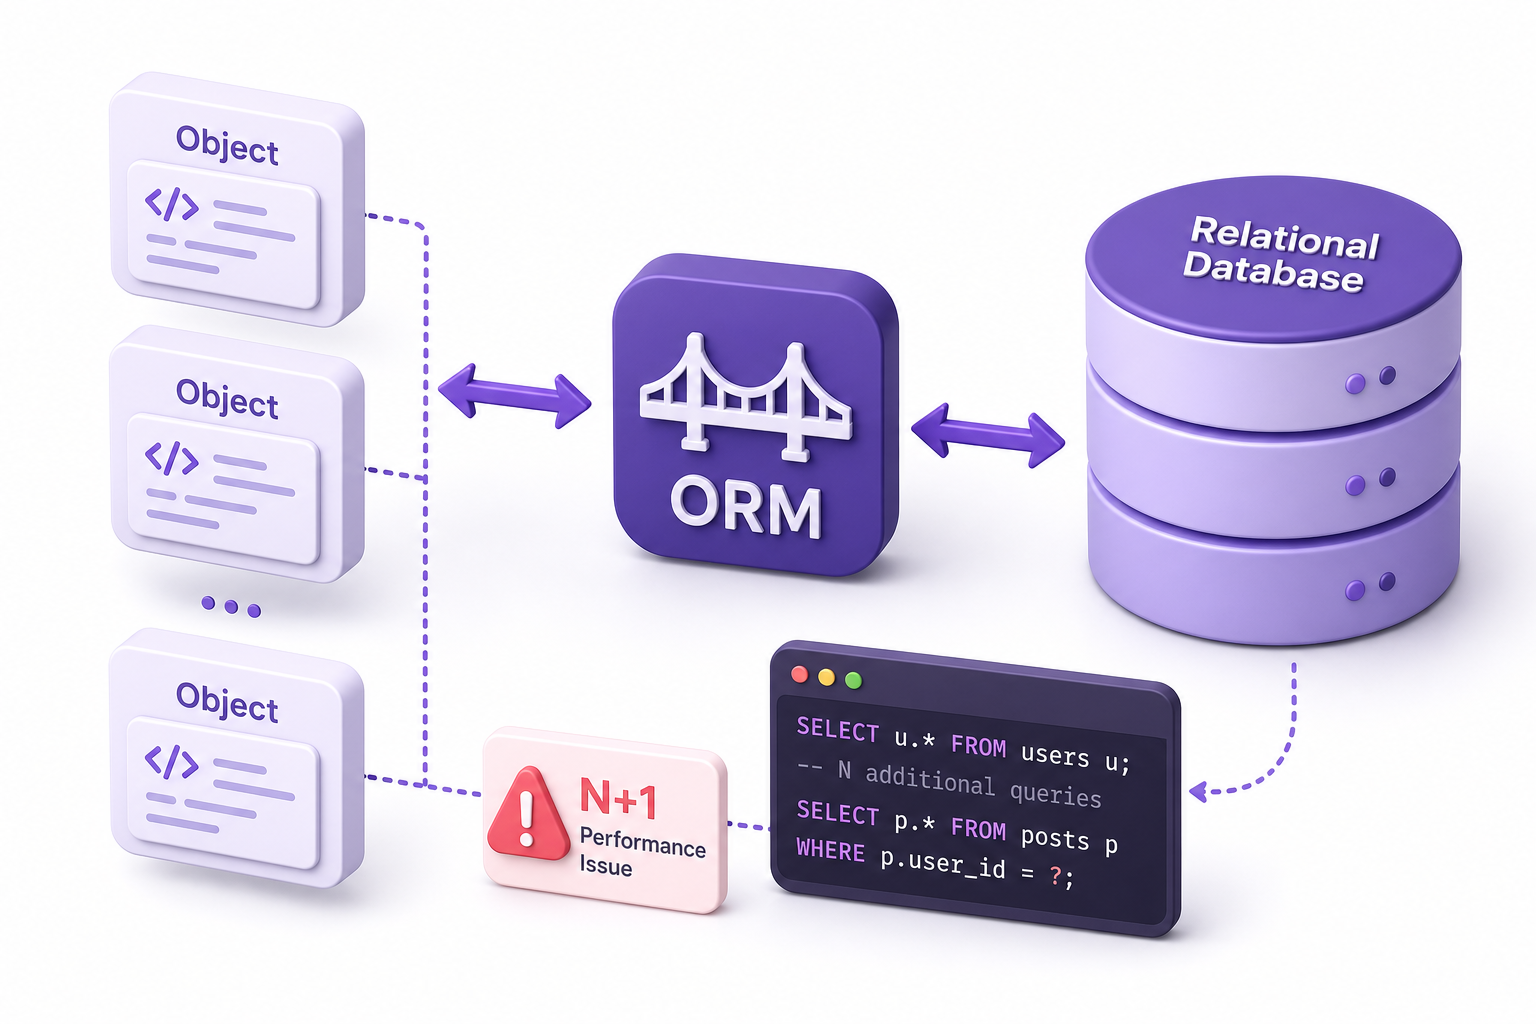
How to Use ORMs and Survive
ORMs hide a lot of database work, and most performance disasters trace back to that abstraction. A practical guide to N+1 queries, fan-out joins, lazy vs eager loading, isolation levels, migrations, and when to drop to raw SQL.
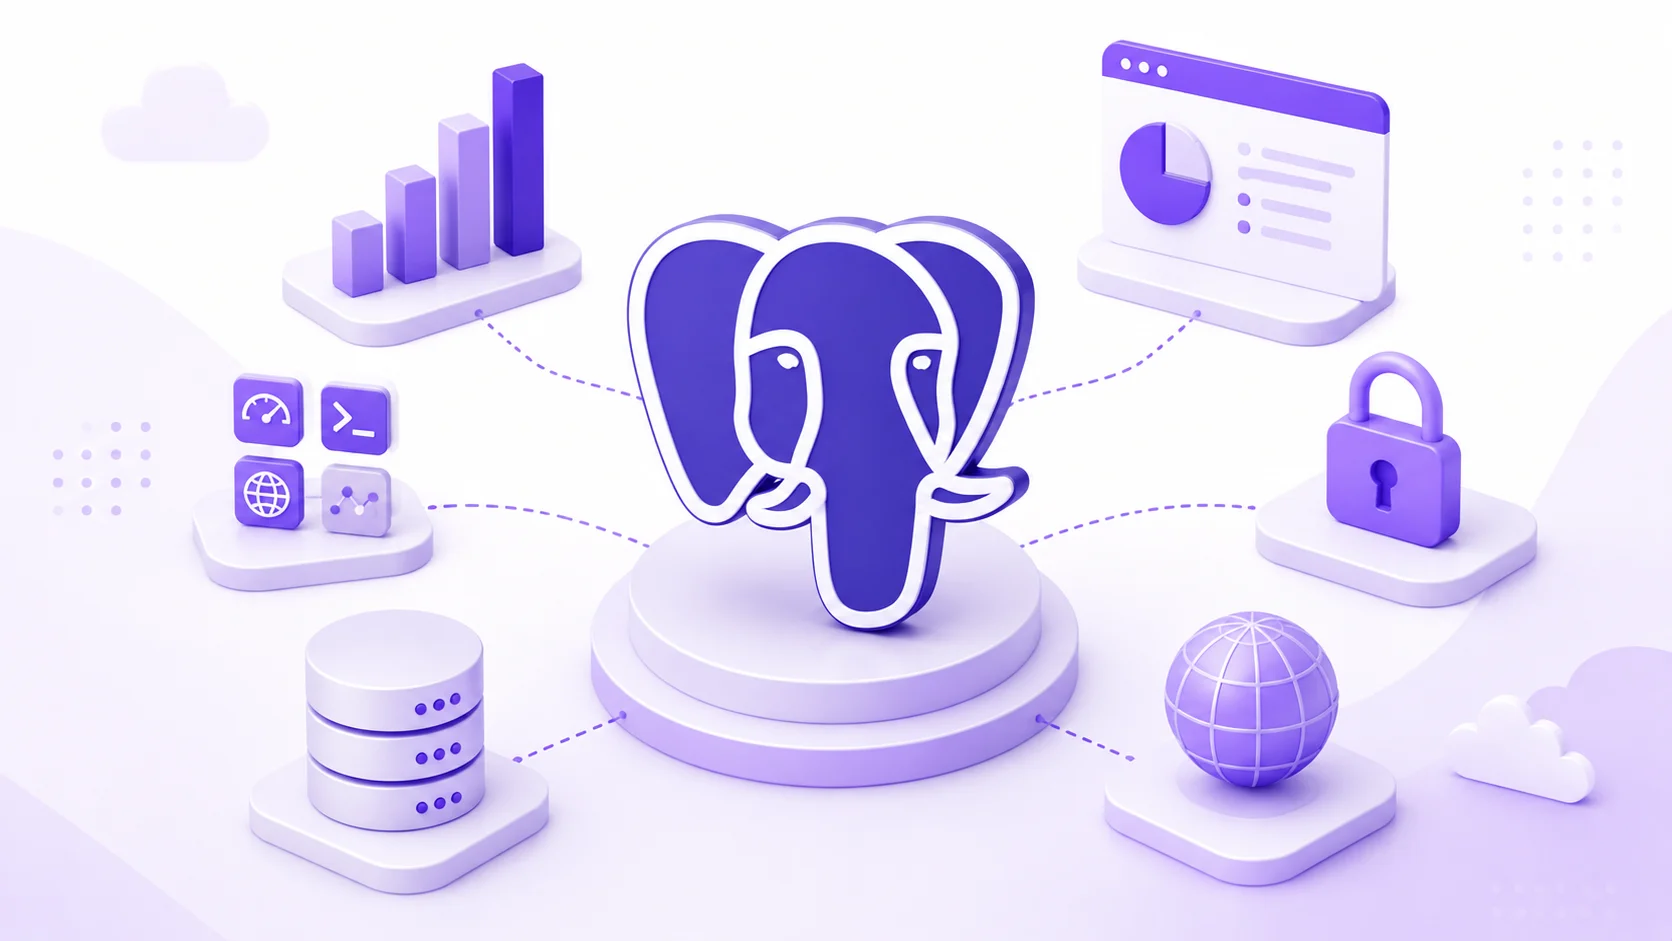
Everyone Uses PostgreSQL... But Why?
PostgreSQL is the most-used database in the Stack Overflow 2025 survey (55.6%), and in 2025 both Databricks and Snowflake paid billions to own a piece of it. Here is why - its permissive license, extensibility, SQL compliance, and the real trade-offs you take on at scale.
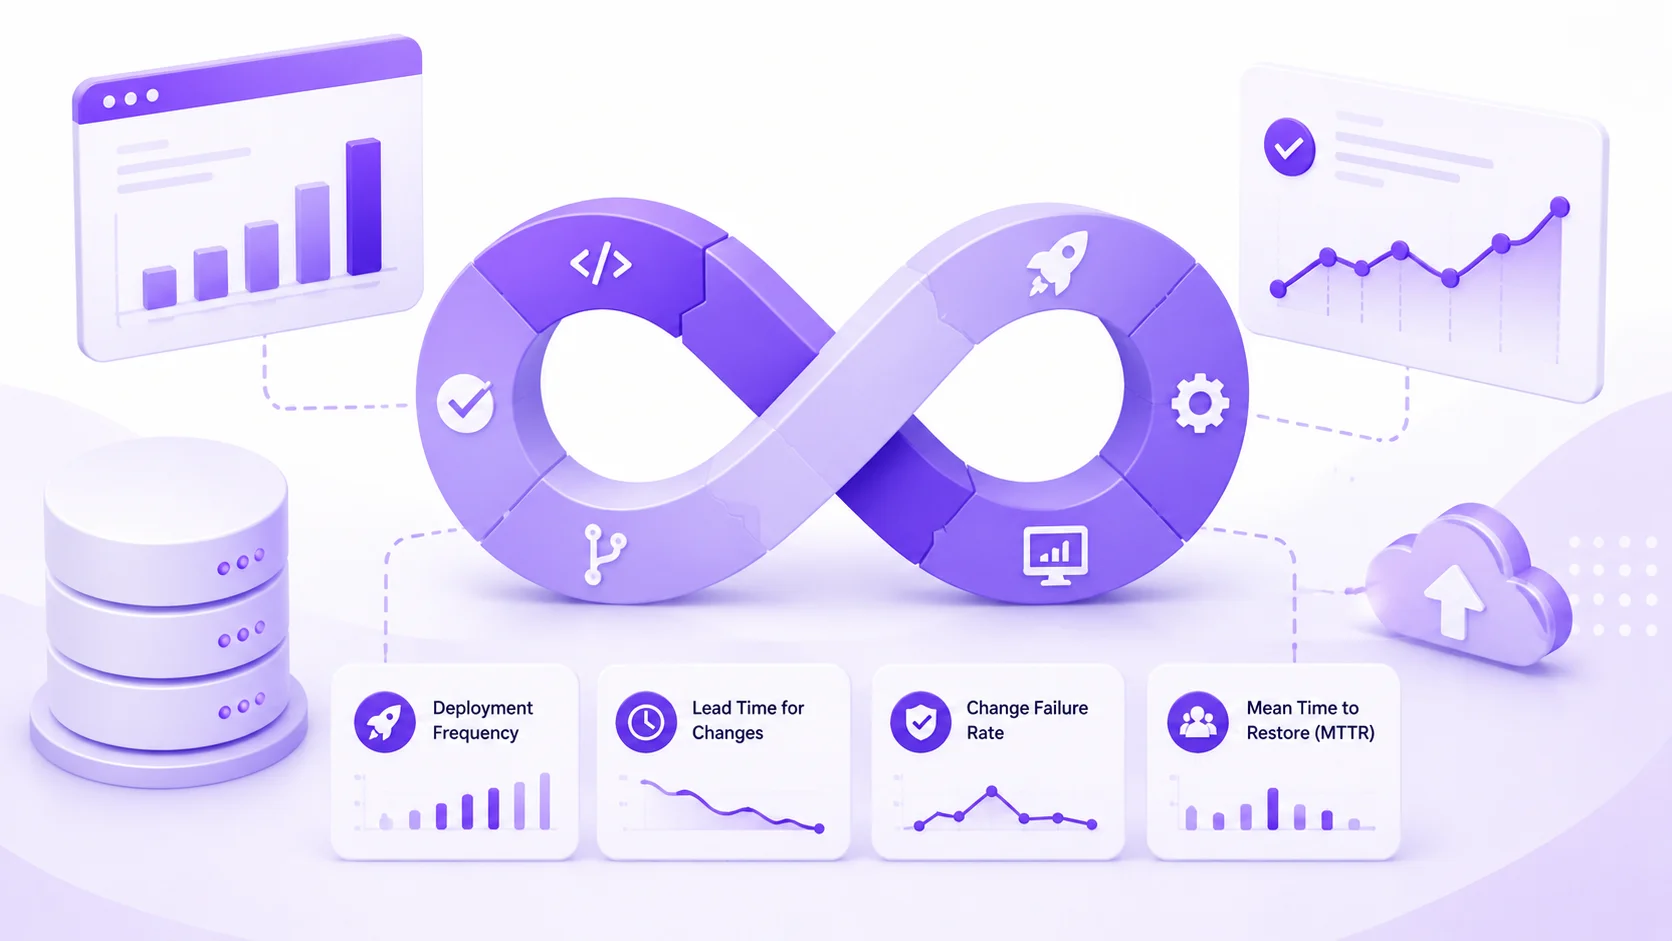
Mastering DORA Metrics in DevOps: A Guide to Optimizing Software Delivery
DORA metrics measure software delivery performance across throughput and stability. A practical guide to the now-five metrics, what DORA's 2025 and 2026 research found about AI's effect on delivery, and how to instrument them.
Observability vs Monitoring: Key Differences and How They Pair
Monitoring watches known signals against thresholds and tells you that something broke. Observability lets you ask new questions of a system and understand why. Here is how the two differ, how they pair, and what that means for databases.
What Is Database Monitoring and Why You Need It
Database monitoring is the continuous observation of a database's performance, health, and availability. This guide explains what to monitor, the difference between reactive and proactive monitoring, and how it connects to query optimization and capacity planning.
8 Proven Strategies to Improve Database Performance
A practical, vendor-neutral guide to faster databases: indexing, query optimization, caching, normalization, hardware, tuning, backup, and partitioning—what each technique does, when to use it, and the trade-offs.
Stay Updated with Elasticsearch & OpenSearch Insights
Get expert tips for making Elasticsearch and OpenSearch more efficient and easier to manage, delivered to your inbox.
Ready to Optimize Your Elasticsearch or OpenSearch Clusters?
Get NeverBlink to enable proactive monitoring and 24/7 expert support for your clusters.