


ClickHouse's most infamous error message doesn't talk about disk space or memory. It says this:
DB::Exception: Too many parts (N). Merges are processing significantly slower than inserts.
That's an unusual thing for a database to tell you: the write gets rejected not because anything is full or locked, but because the server's own internal bookkeeping has fallen behind. Understanding why requires understanding what a "part" is, what creates one, and what a background process called merging is supposed to do about them before you ever hit that ceiling.
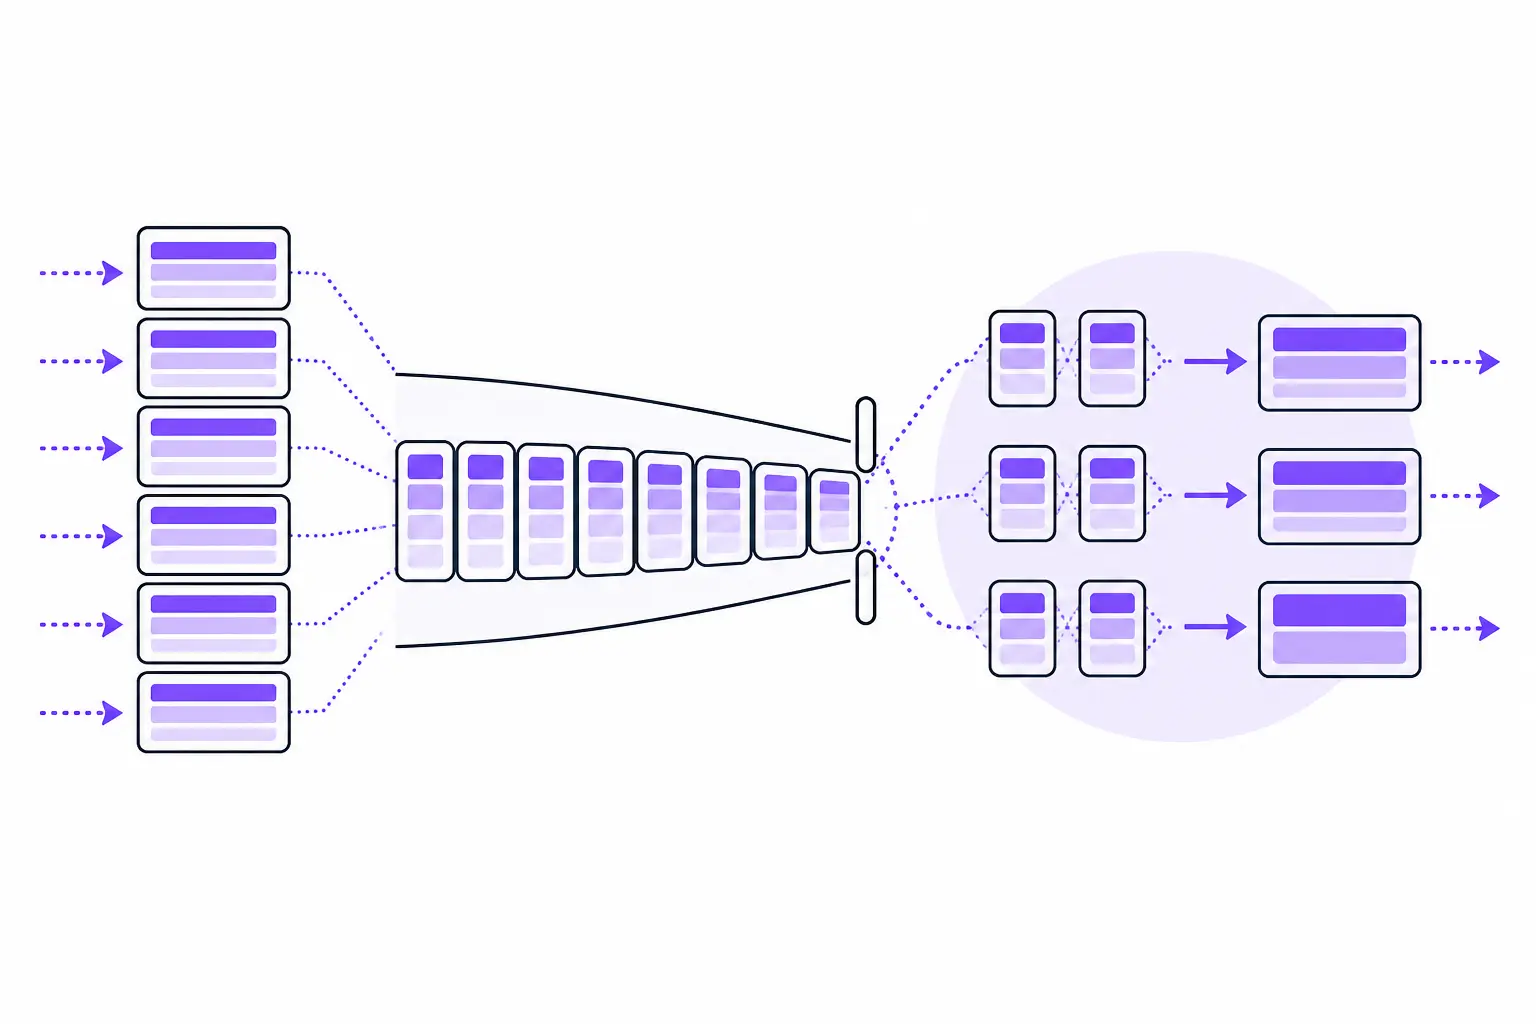
Parts, Not Rows
A MergeTree table doesn't store rows the way a row-oriented database does. It stores parts: self-contained directories on disk, each holding a slice of the table's data, sorted, compressed, and indexed independently of every other part. A table is really just the union of its currently active parts.
CREATE TABLE events
(
    event_time DateTime,
    tenant_id  UInt64,
    event_type LowCardinality(String),
    properties String
)
ENGINE = MergeTree
ORDER BY (tenant_id, event_type, event_time)
PARTITION BY toYYYYMM(event_time);
Two clauses do the structural work here. PARTITION BY decides which coarse bucket a row lands in - month, in this case - and ClickHouse never merges parts across that boundary; each partition manages its own set of parts independently. ORDER BY decides the sort order within a part, and it's also the definition of the table's primary index. That second point trips people up coming from other databases, because in ClickHouse the primary key is not a uniqueness constraint. Nothing stops you from inserting two rows with the same (tenant_id, event_type, event_time). ORDER BY just tells ClickHouse how to physically sort the data, which is also what the sparse index is built from - one index entry per 8,192-row granule by default, storing only the sort-key values of that granule's first row. It narrows a query down to a handful of granules; it does not police duplicates. The MergeTree guide covers the full decision process for picking ORDER BY and PARTITION BY, which matters more than almost anything else you'll configure on the table.
What an INSERT Actually Does
Run an INSERT and ClickHouse doesn't go find the right place to slot your rows into an existing structure. It writes a brand-new part: one file set per column, sorted and compressed, with a fresh sparse index alongside it. If your insert touches three different months, it writes three parts - one per partition. Small parts under roughly 10 MiB get written in a compact single-file layout for cheapness; merging later promotes them to the wide, one-file-per-column layout that large parts use.
This is why ClickHouse inserts are fast: there's no index to update in place, no row-level locking, nothing to coordinate beyond appending a new directory. It's also exactly why a stream of tiny inserts is a problem waiting to happen, which is the second half of this post.
You can watch parts accumulate directly:
SELECT
    partition,
    name,
    level,
    active,
    rows,
    formatReadableSize(bytes_on_disk) AS size
FROM system.parts
WHERE table = 'events' AND active = 1
ORDER BY partition, name;
A part fresh off an INSERT has level = 0 - it has never been merged. Every time ClickHouse merges a set of parts, the result's level is one higher than the max of its inputs, and its block-number range spans the full range of everything it absorbed. A partition full of level = 0 parts is a partition that isn't being merged; a rising average level is a partition that's healthy.
What Merging Actually Does, and Why It's Expensive
Background merges are the process that turns many small parts into fewer, larger ones. A merge task picks a set of parts in the same partition, reads them, decompresses the column data, merges the sorted streams row by row, recompresses the result, and writes it as a new part with a higher level. The old parts are marked inactive rather than deleted immediately - queries already in flight keep reading them until nothing references them anymore, which is how ClickHouse gets snapshot isolation without row locks.
None of those steps are cheap. Decompression and recompression are CPU work; reading the old parts and writing the new one is IO work; and merges targeting more than 10 GiB of source data (the min_merge_bytes_to_use_direct_io default) bypass the page cache entirely with O_DIRECT, so they compete for raw disk throughput too. This is why top on a busy ClickHouse node can show 200-400% CPU with no queries running at all - that's the write path doing its job. A server taking any meaningful ingest rate will have merges running continuously; ClickHouse publishes no official sizing ratio here, but planning for 30-50% of cores going to background merge work at sustained ingest is a common practitioner heuristic, not a worst case.
The concurrency here is governed by two settings: background_pool_size (16 threads by default) multiplied by background_merges_mutations_concurrency_ratio (2.0 by default), giving up to 32 concurrent merge and mutation tasks. ALTER TABLE ... UPDATE/DELETE mutations run through this same pool, competing directly with ordinary merges for the same slots - a wide mutation on a large table can starve regular compaction for hours. Background merge pressure goes deeper into diagnosing pool saturation and IO contention specifically.
The Mechanism Behind "Too Many Parts"
Merging is asynchronous and, critically, it can lag behind ingestion. If inserts keep creating new parts faster than the pool can consolidate them, the part count in a partition just climbs. Left unchecked, that's bad for reads too - every query has to open and scan more files, so ClickHouse doesn't leave it unchecked. It defends itself with two per-partition thresholds:
parts_to_delay_insert(default 1000, since version 23.6): once active parts in a partition cross this, ClickHouse starts adding an artificial delay to every insert into that partition. The delay grows linearly as the count climbs toward the throw threshold:delay_ms = max(10, 1000 * (parts_count - parts_to_delay_insert + 1) / (parts_to_throw_insert - parts_to_delay_insert)).parts_to_throw_insert(default 3000, since version 23.6): cross this and the insert is rejected outright with the error at the top of this post.
Before 23.6 those defaults were 150 and 300 - an order of magnitude tighter, which is why older blog posts and forum threads about this error can be misleading if you don't check which version they're describing. There's also a table-wide ceiling independent of partitioning, max_parts_in_total (default 100,000), and a separate pair of settings for inactive parts (inactive_parts_to_delay_insert / inactive_parts_to_throw_insert) that are disabled by default.
The throttling is the tell. By the time you see the hard rejection, ClickHouse has already been quietly slowing your inserts down for a while - a spike in average insert duration with no corresponding spike in data volume is exactly what that looks like in system.query_log. It's the server's way of buying the merge pool time before it has to start refusing writes outright. The too-many-parts guide walks through the full diagnostic path and the fixes in more depth than there's room for here.
Reading the Signals Directly
Two queries cover most of what you need. First, which partitions are actually accumulating parts:
SELECT
    database,
    table,
    partition,
    count()                                        AS part_count,
    sum(rows)                                       AS total_rows,
    formatReadableSize(sum(data_compressed_bytes))  AS total_compressed
FROM system.parts
WHERE active = 1
GROUP BY database, table, partition
HAVING part_count > 100
ORDER BY part_count DESC
LIMIT 20;
Second, whether the merge pool itself is the bottleneck or just the symptom:
SELECT metric, value
FROM system.metrics
WHERE metric IN (
    'BackgroundMergesAndMutationsPoolTask',
    'BackgroundMergesAndMutationsPoolSize'
);
If the task count sits at the pool size, merges are queuing behind a full pool and more capacity (a larger background_pool_size, given the CPU headroom to back it) will help. If the pool has room to spare and parts are still piling up, the problem isn't merge capacity - it's the insert pattern. That's almost always one of two things: inserts too small and too frequent (batch to at least 10,000 rows, or turn on async_insert so the server buffers small client writes into one part server-side), or a partition key with too much cardinality, where toYYYYMMDD or a tenant-ID partition multiplies a 3,000-part-per-partition limit across thousands of partitions and the table blows well past workable part counts long before any single partition trips the threshold on its own.
The metric worth alerting on before any of this becomes an incident is MaxPartCountForPartition from system.asynchronous_metrics - the highest active part count in any partition, across every MergeTree table on the server. A warning around 300 and a critical alert well before 1000 gives you room to fix the insert pattern before ClickHouse starts fixing it for you with delays and, eventually, rejections.
None of these thresholds are wrong to raise temporarily while a backlog clears - ALTER TABLE ... MODIFY SETTING parts_to_throw_insert = 5000 buys the merge pool breathing room during a known catch-up window. What it doesn't do is fix a partition key that produces ten thousand partitions or an application that inserts one row at a time. Raising the ceiling just moves the wall back; the part count still has to come down, and every unmerged part sitting there in the meantime is disk that queries have to open and CPU that merges will eventually have to spend anyway.
This is the kind of thing NeverBlink is built to catch before it turns into an incident - it tracks MaxPartCountForPartition, pool saturation, and insert throttling across your ClickHouse clusters and tells you specifically which table, which partition, and which setting is worth changing. It surfaces the recommendation and the reasoning behind it; someone who knows the workload still decides whether to batch the writer differently, repartition the table, or just widen the pool for now. The mechanism is the same everywhere: parts accumulate, merges consolidate them, and the two thresholds exist so that when the second process falls behind the first, the database tells you loudly instead of degrading quietly until a query timeout does it for you.