

One platform for continuous database maintenance.
Health checks, root-cause analysis, query analytics, cost optimization and expert support work from the same live context. Your engineers see it in the UI, and their agents get it through the API and MCP.
Continuous, not periodic
Health, performance, resilience and cost are evaluated all the time, not just during an incident or a quarterly review.
Actionable, not just observable
Every finding comes with a diagnosis and a concrete next step instead of another unexplained red graph.
Automated, but accountable
AI carries the investigation. Engineers keep visibility and control over every change that matters.
Continuous maintenance, run by an AI that knows each engine's internals.
NeverBlink recommends. Your engineers apply. Every finding comes with its evidence and the exact change.
Health check-ups that never stop
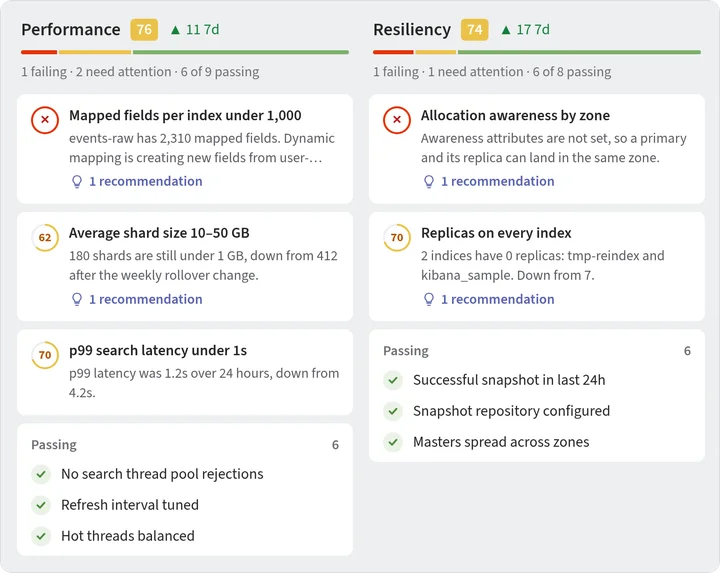
Every cluster gets a 0–100 score across stability, performance, resiliency and security. The checks behind it are engine-specific: shard allocation and snapshots for search, part counts and merge pool saturation for ClickHouse. A failing check says what is wrong, where, and what to do about it.
- Re-evaluated continuously, with day to year timelines
- Ignore checks that don't apply, such as replicas on a dev cluster
- Health reports delivered on a schedule you choose
4 hrs of engineering time per weekTypical saving. Your mileage will vary.
Actionable recommendations, with the fix spelled out
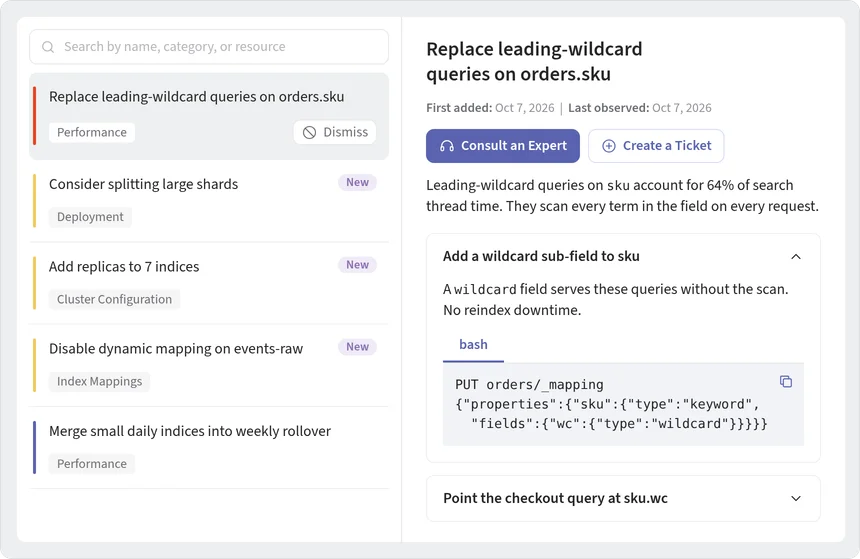
NeverBlink compares what it collects against best practices curated from years of running these engines in production, and turns every gap into a prioritized recommendation. Each one explains the issue, why it matters and the exact steps to fix it.
- Engine-specific: index mappings for search, schema and pipelines for ClickHouse
- Create Jira, GitHub Issues or Azure DevOps tickets in one click
- Clears itself once the issue is fixed. Dismiss what doesn't apply, and restore it any time
Every alert gets investigated before you open it
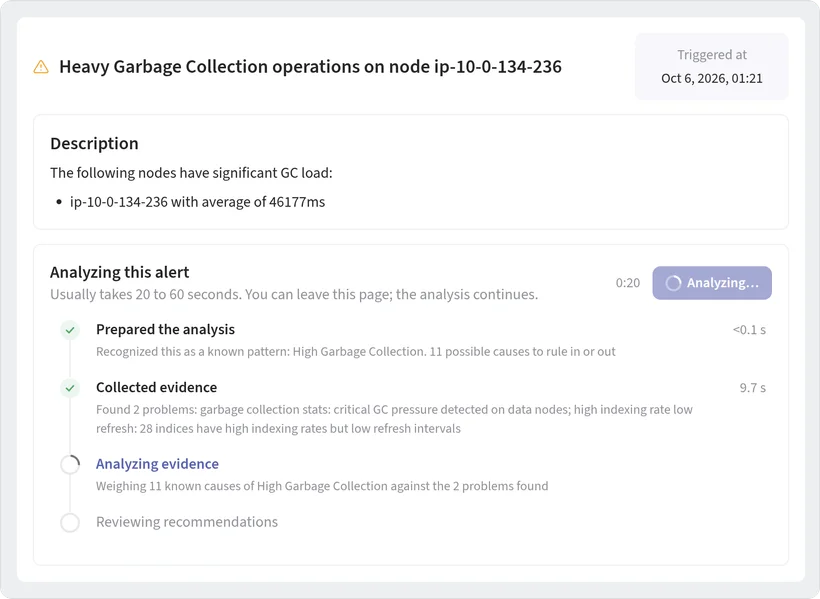
When an alert fires, NeverBlink starts a root-cause analysis on its own. It matches the alert to known failure patterns, collects evidence from the cluster, weighs each possible cause against it, and returns what happened, what it affects and what to run, usually in under a minute. Mark deploys on the timeline and regressions point straight at the change.
- Grounded in 15+ years of running these engines in production
- Copy-paste commands for each step, and an expert a message away from the same screen
- NeverBlink never changes your cluster on its own. Your engineers apply the fix.
50 hrs of engineering time per monthTypical saving. Your mileage will vary.
Every engine, every cloud, one pane of glass
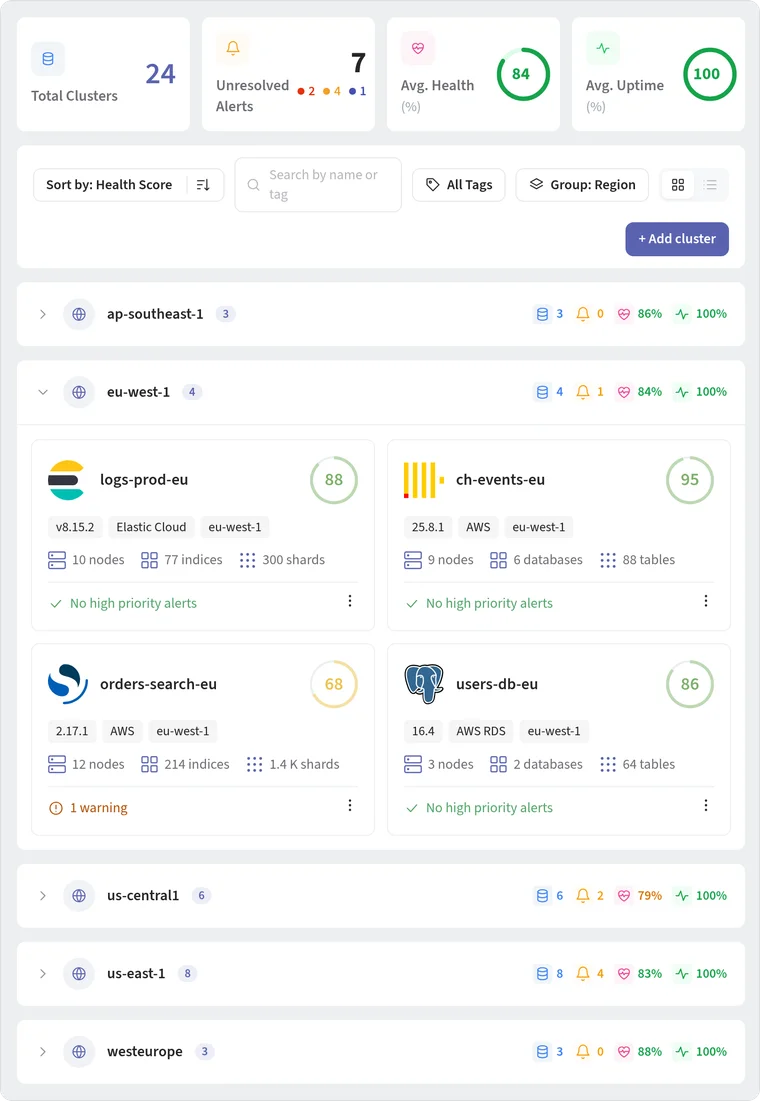
Run three clusters or three hundred. See health, open alerts and uptime across every engine, cloud and region, then sort, search, filter by tag and group by technology, cloud provider, region or version.
- Group by region, cloud, technology or version
- Filter by tags and search by name
- Card and list views
10 hrs of engineering time per weekTypical saving. Your mileage will vary.
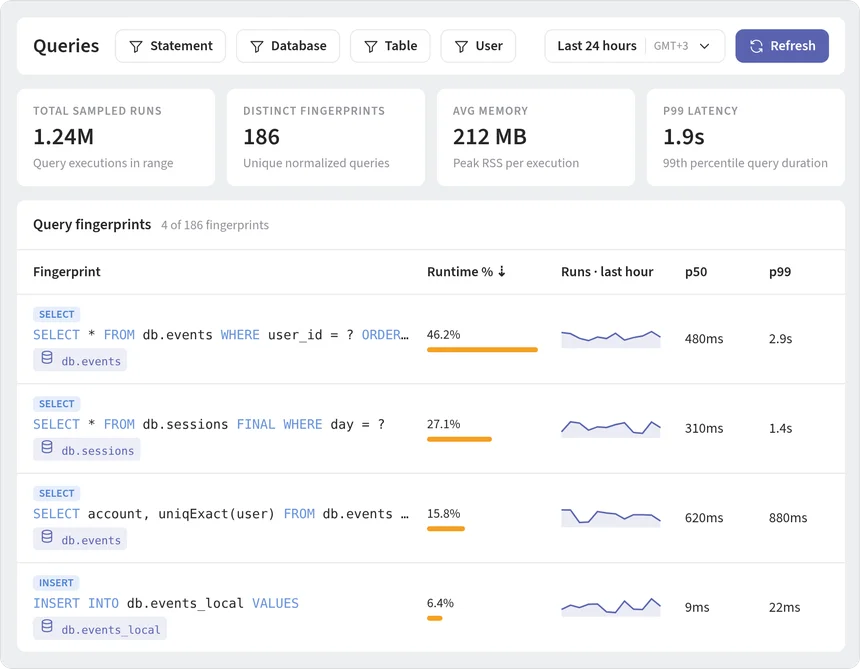
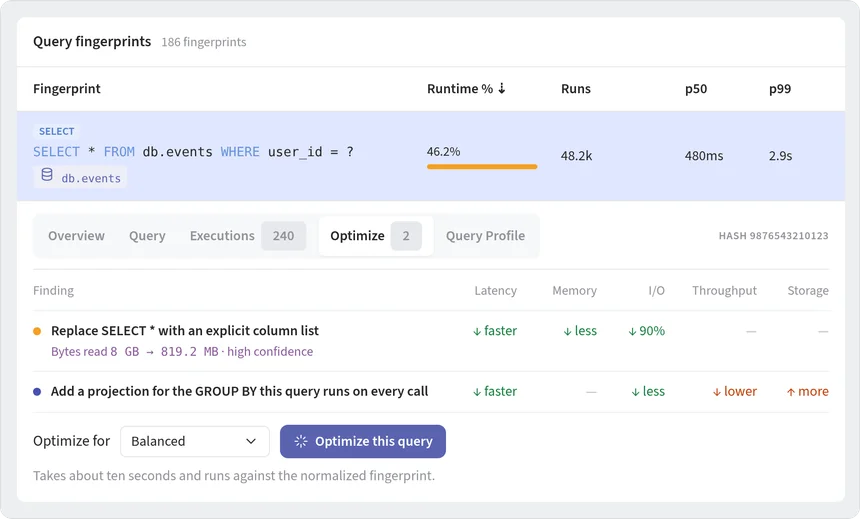
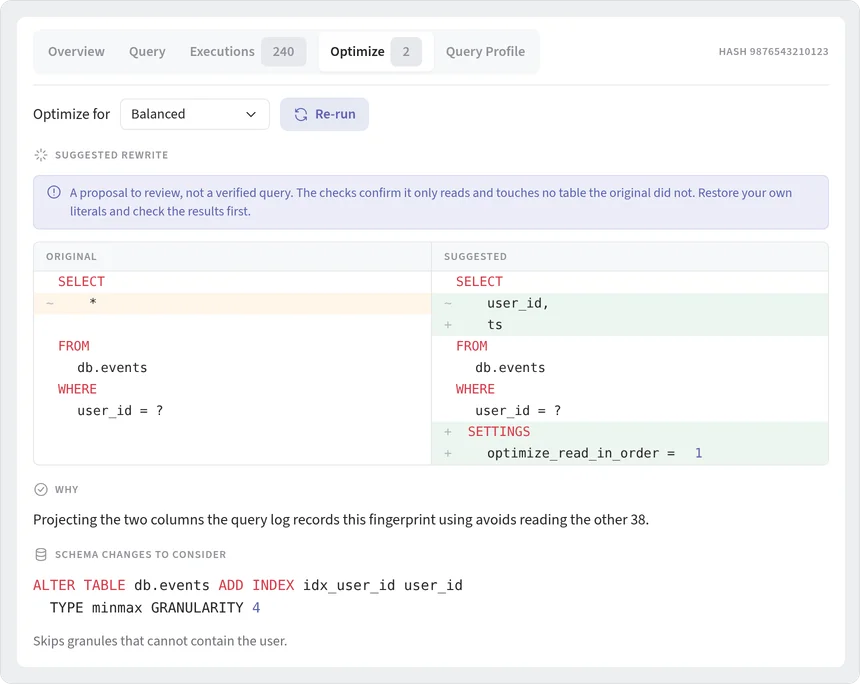
Query analytics: find the queries behind the bill, and get the faster version.
Most database load comes from a handful of query shapes. NeverBlink finds them, explains what makes them expensive, and proposes a safer, faster rewrite you can review before you ship it. Available for ClickHouse, Elasticsearch and OpenSearch, with literal values masked before they leave your network.
$1,000s in hardware costsTypical saving. Your mileage will vary.
The rest of the deck.
The summary that tells you what changed, the charts for when you want to look yourself, and alerts that reach you where you already work.
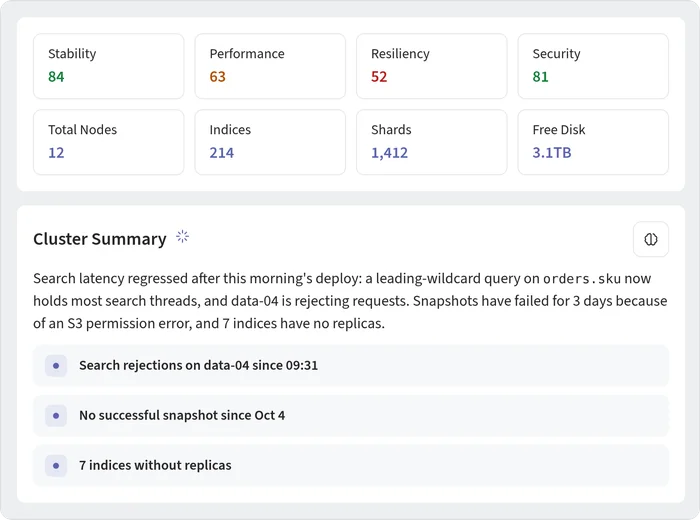
The state of your cluster, in plain language
Every cluster's overview opens with an AI-written summary of what matters right now: the critical risks and regressions, with the evidence behind them. You don't have to dig through dashboards to find out what changed.
- Refreshed as new data arrives
- Links each point to the check, alert or recommendation behind it
- Written from engine-specific reasoning, not generic advice
When you do want the charts, they're good ones
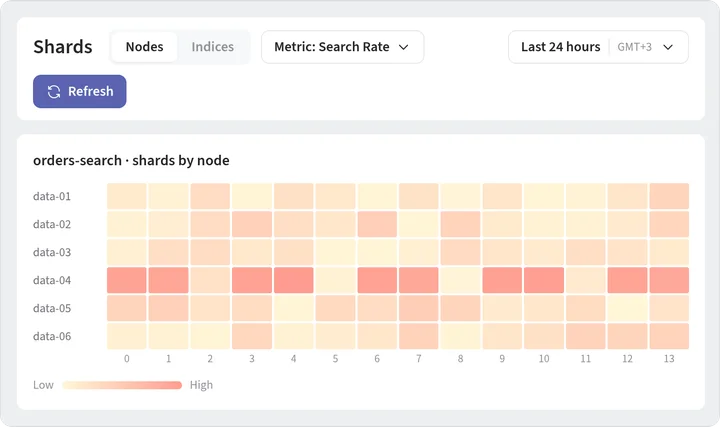
Pre-built dashboards for nodes, indices, shards and pipelines. Rollover indices group automatically by pattern. Shard heatmaps let you drill from a hot node to the index and shards behind it.
- Index treemap for storage and shard layout at a glance
- Markers that put deploys and incidents on every timeline
- Anomaly detection on the metrics that matter
Alerts go where your team already works
Three severity levels (critical, warning and informative) with thresholds you can tune per cluster. Each alert links back to its root-cause analysis.
Built for your team, and for the agents they build with.
Coding agents now write queries, change schemas and ship at machine speed. Give them the same live context your engineers use, so they reason from evidence about your data platform instead of guessing. They propose; your team approves.
A UI built for the team
Cluster health, recommendations, alerts and root-cause analysis in one place.
REST API and MCP server
Pull health, alerts and recommendations into your workflows, CI and internal tools.
Signals for agents
Agents ask what changed, see the evidence, and propose a fix. Engineers stay in control.
Tools engineers use even before they sign up
Built from the same engine knowledge as the platform, and free to use.
Query Optimizer
Paste a slow Elasticsearch query and get concrete optimization recommendations.
Try it →Also available: VS Code extensions for Elasticsearch and OpenSearch.