

Database Observability, Not Just Dashboards
NeverBlink unifies metrics, logs, query analytics, and configuration insights across Elasticsearch, OpenSearch, ClickHouse, and PostgreSQL - then adds AI-powered root-cause analysis so you understand why, not just what.
What is Database Observability?
Database observability is the ability to understand the internal state and behavior of your databases - performance, resource usage, query patterns, and configuration - from the signals they emit, so you can explain and predict issues rather than just detect them. Monitoring tells you a metric crossed a threshold; observability tells you why, what it impacts, and how to fix it.
NeverBlink was built for exactly that: it continuously collects and correlates metrics, logs, slow queries, and cluster configuration, and applies agentic AI analysis on top - across search, analytics, and transactional databases, self-managed or in the cloud.
All Signals, One Platform
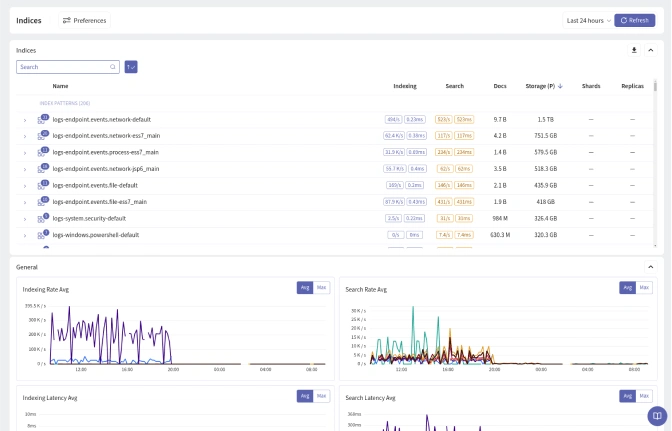
Metrics, Logs, Queries, and Configuration - Correlated
-
 Unified Dashboards and Historical Trends: Out-of-the-box dashboards for every supported database, with historical metrics and trends - no agent sprawl, no dashboard-building projects, no per-signal tooling.
 -
 Query-Level Visibility: See which queries drive load, latency, and cost. Slow query analysis and query analytics reveal the workload behind the resource graphs.
 -
 Every Database You Run: Elasticsearch, OpenSearch, ClickHouse, and PostgreSQL - fully-managed or self-hosted, across clouds and on-prem, in a single pane of glass.
From Symptom to Root Cause
AI-Powered Analysis on Top of Your Telemetry
-
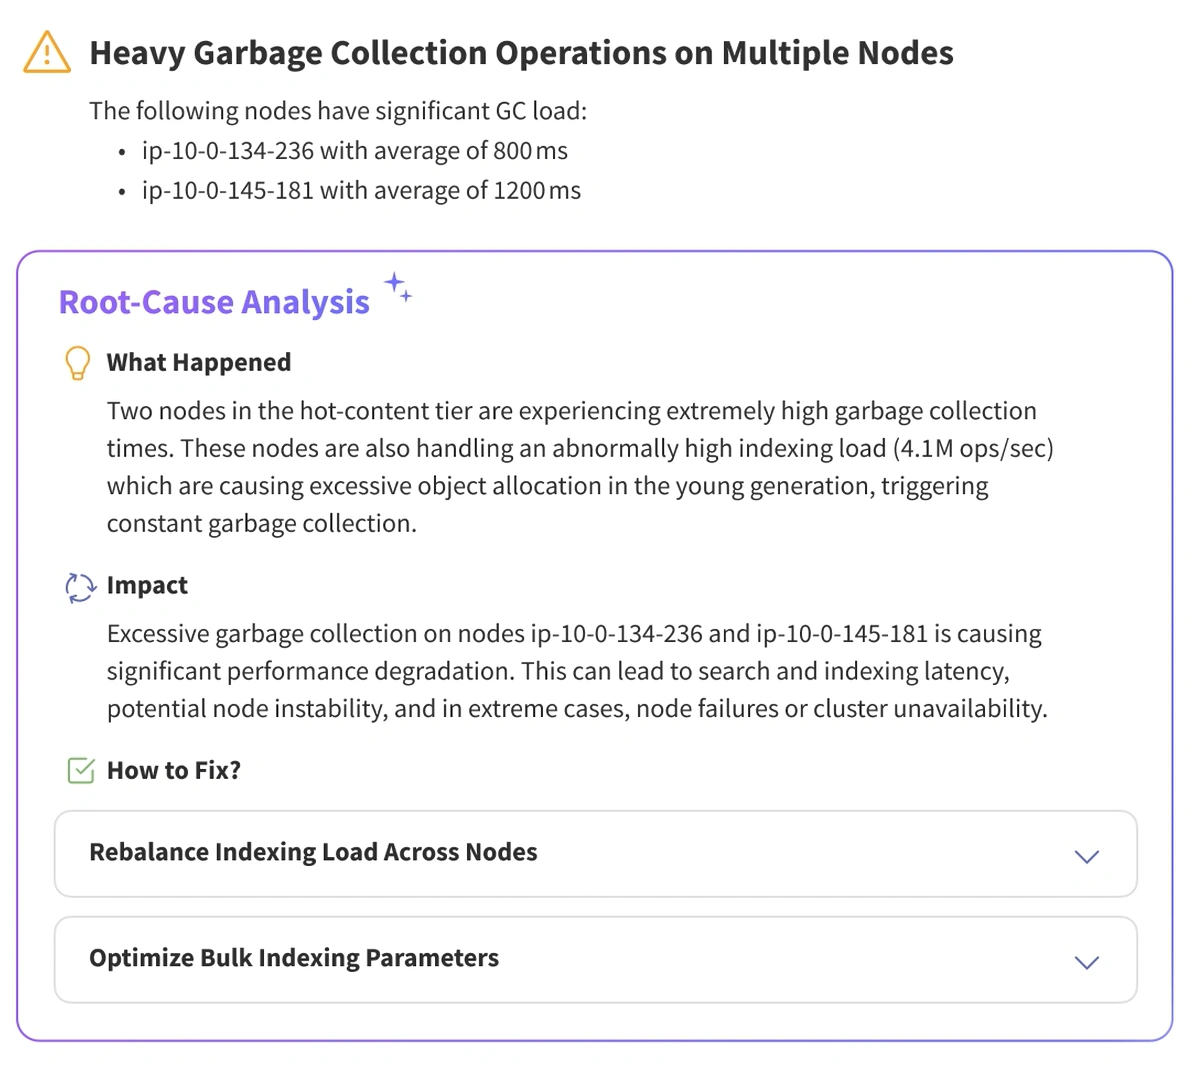
 Agentic Root-Cause Analysis: NeverBlink correlates metrics, logs, and configuration changes to pinpoint the actual cause of an incident - and recommends the fix, validated against your setup.
 -
 Anomaly Detection and Smart Alerting: AI-driven baselines adapt to your workload patterns, catching real anomalies early while cutting alert fatigue. Alerts arrive with context and impact analysis.
 -
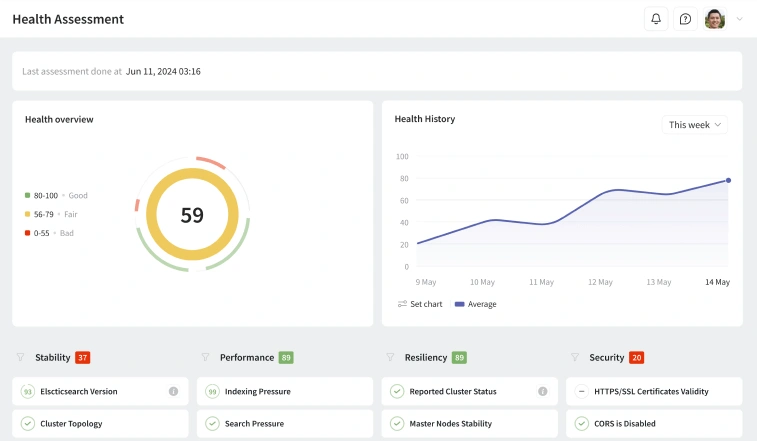
 Continuous Health Assessments: Daily automated assessments surface risks, misconfigurations, and cost-optimization opportunities before they become incidents.
Observability That Acts
Close the Loop From Insight to Resolution
-
 Guided Remediation: Every finding comes with concrete, actionable steps - so the person on call can resolve issues in minutes, whether or not they are a database expert.
 -
 Cost and Capacity Insights: Workload analysis ties observability data to spend, revealing over-provisioned nodes, wasteful queries, and storage that can be tiered or trimmed.
 -
 Human Experts Behind the Platform: When AI insights are not enough, NeverBlink is backed by engineers who run these databases in production every day - available under SLA.
Observability vs. Monitoring: Why the Difference Matters
Traditional database monitoring collects predefined metrics and fires threshold alerts. That catches known failure modes, but production incidents are usually novel combinations: a query pattern change plus a config drift plus a noisy neighbor. Observability means having rich enough signals - and the analysis on top - to diagnose problems you didn't predict in advance.
Read more: Observability vs. Monitoring, Database Monitoring Best Practices, and What is Monitoring and Logging.