

 NeverBlink for Elasticsearch
Elasticsearch expertise on call, without hiring for it.
More than a decade of building, scaling and rescuing Elasticsearch clusters, turned into continuous checks, root-cause analysis and precise recommendations. It works for any version on any infrastructure, with senior engineers available when it matters.
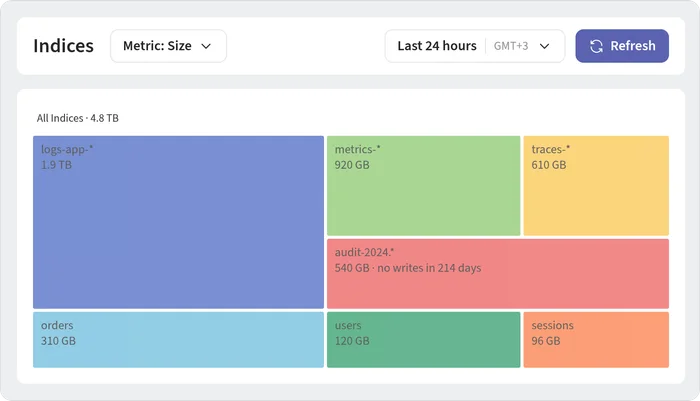
See your storage and shard layout at a glance
A treemap of every index, sized by storage, with states marked. Spot the oversized and forgotten indices immediately, then drill in.
- Last-event timestamps reveal inactive indices
- Closed and frozen indices clearly marked
- Index list and treemap in one panel
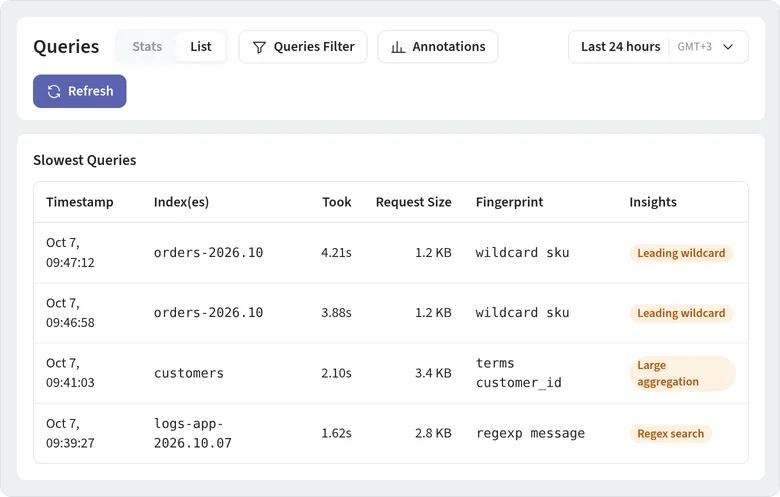
Look past the slowlog
Slowlogs flag queries over a threshold, but slowness often comes from search queue saturation, not the query itself. A lightweight query proxy lets NeverBlink look at all queries over time, group them into fingerprints and spotlight the families that consume the most. It also flags known causes such as regex searches and large aggregations.
Pipelines included
Monitor Logstash instances with Kubernetes autodiscovery, plus ingest pipelines and bulk indexing, with throughput, processing time and error rates. Bulk 4xx responses are highlighted by default.
Elasticsearch is a critical part of our operational platform. Without specialized support, every issue became a crisis. Having NeverBlink in our corner 24/7 is invaluable.
An always-on assistant for your clusters.
That's how Frontiers' DevOps team describes it.