
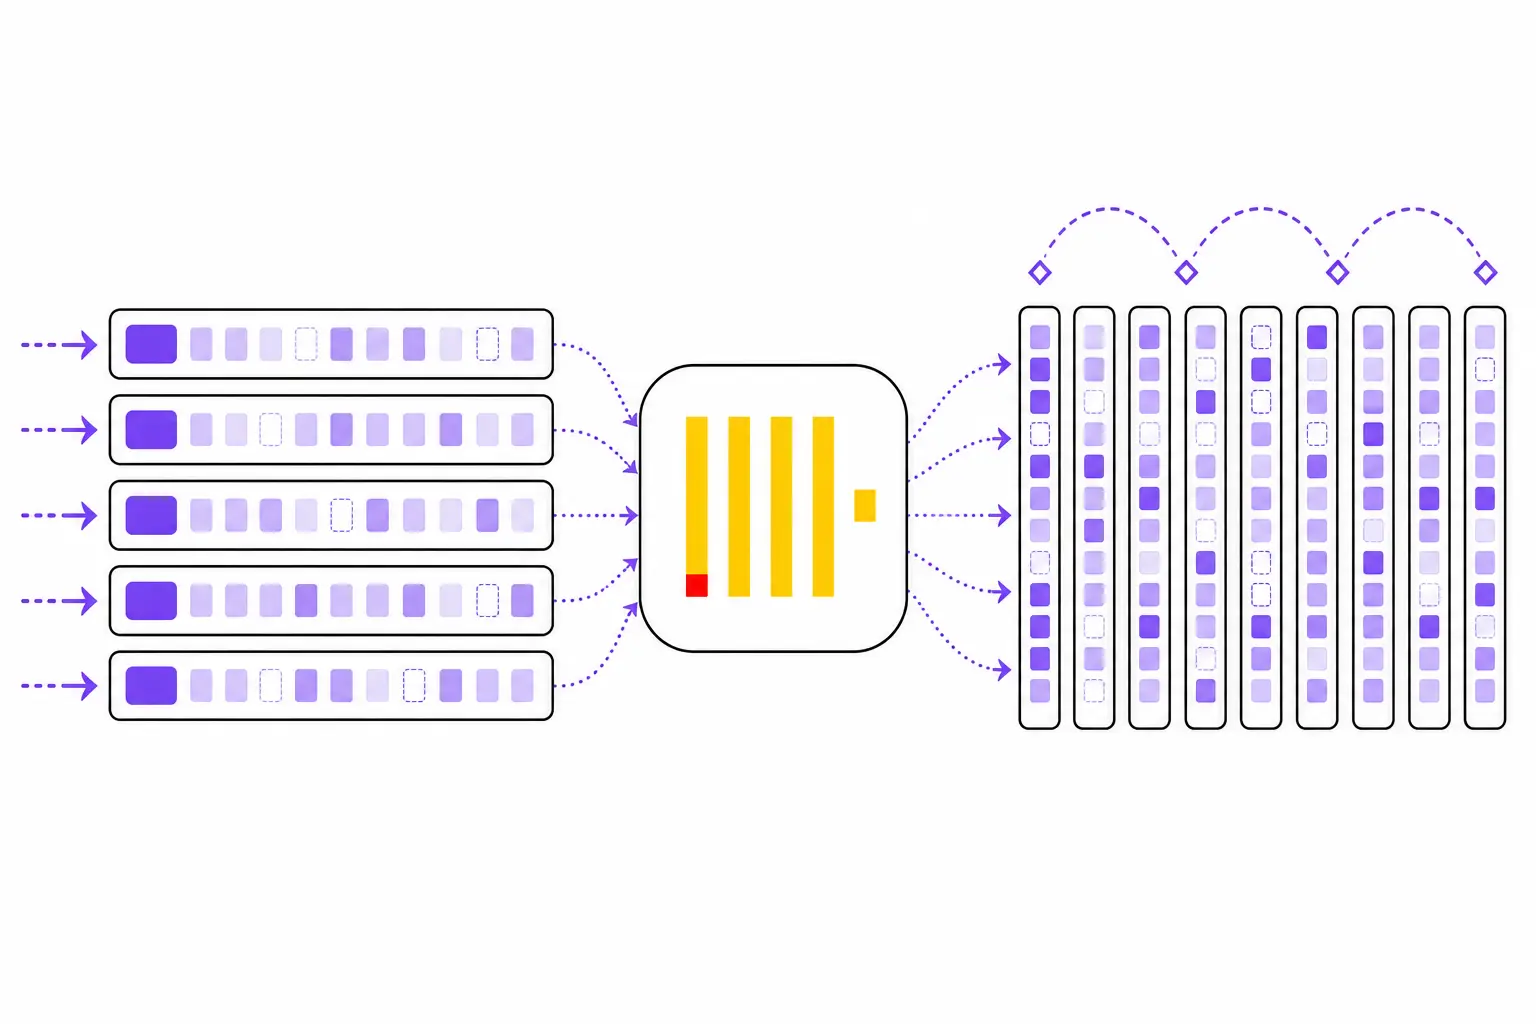
Uber's log platform, Cloudflare's HTTP analytics, Tesla's observability platform covering factories, energy systems, and vehicles, and a whole generation of observability startups - SigNoz, HyperDX, Highlight, qryn - have almost nothing in common in what they build. What they share is the database underneath: all of them store telemetry in ClickHouse. When teams that never talked to each other keep landing on the same backend, it's worth asking what their data has in common that made the same choice fall out of it.
The answer is that observability data has an unusually specific shape, and ClickHouse's storage engine happens to be built around exactly that shape. This post walks through what that shape is, and why the compression ratios and scan speeds people report come from the architecture rather than from tuning heroics.
Telemetry Has a Shape
Strip away the vendor terminology and logs, traces, and metrics events all look like the same thing: a timestamp, a handful of identity fields (service, host, trace ID), and anywhere from a few dozen to a few hundred attributes. The industry has settled on calling these wide events. Three properties define the workload:
- Append-only. Events are written once and never updated. There are no transactions to isolate, no rows to lock, no updates to reconcile.
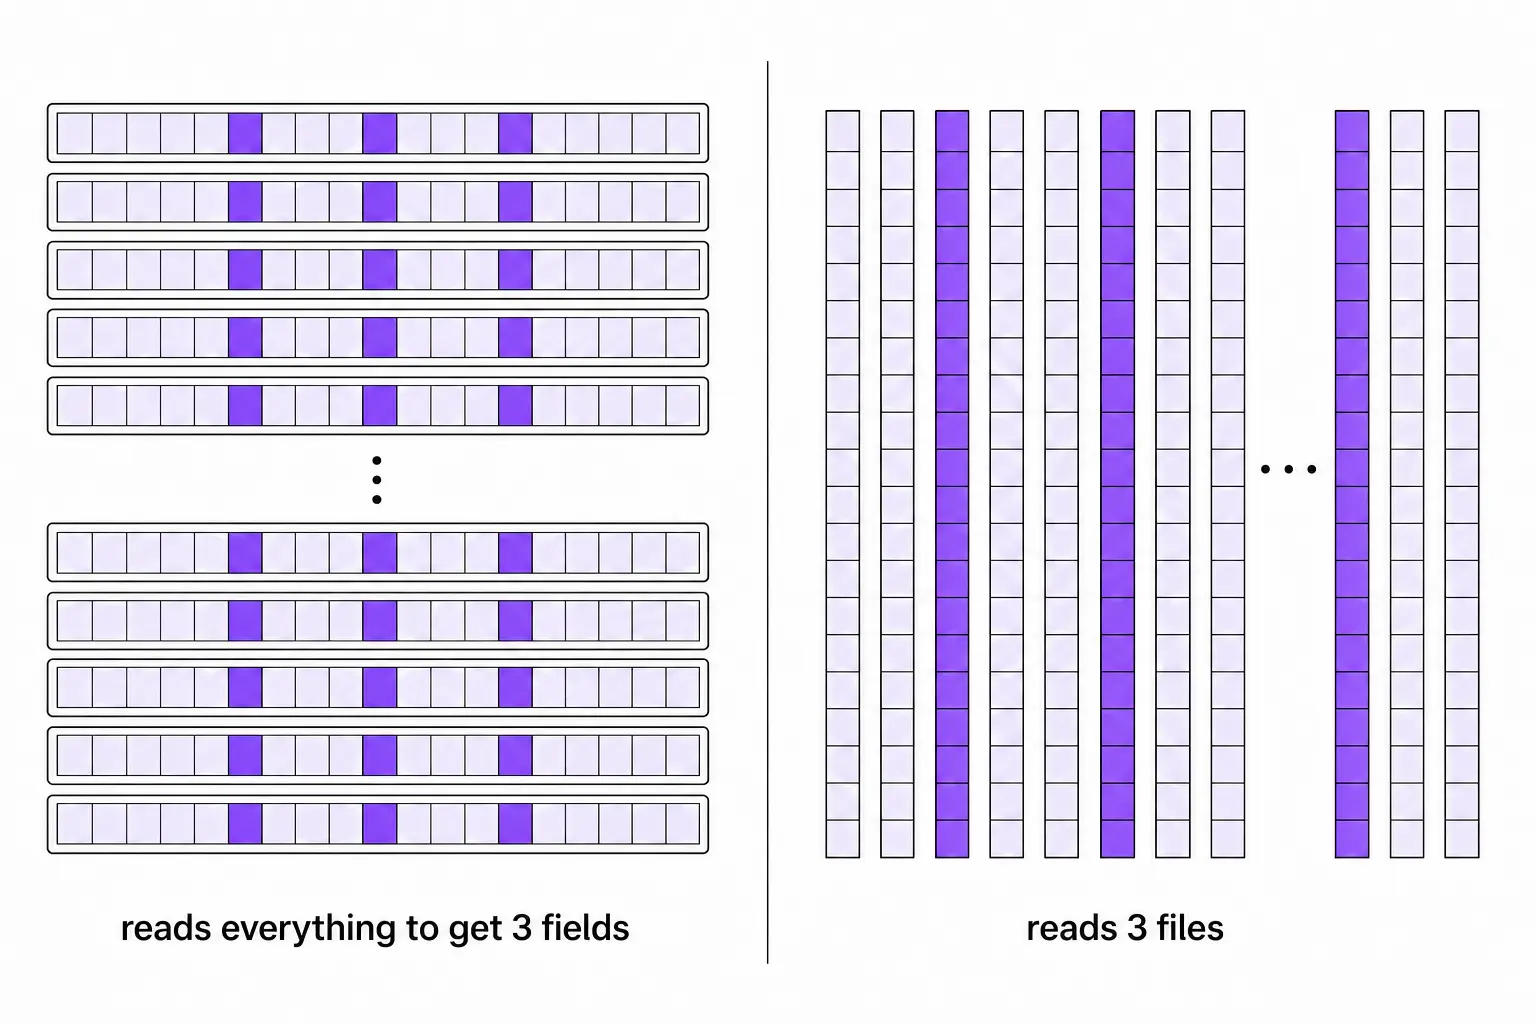
- Written wide, read narrow. An event might carry 200 attributes, but a real query - "p99 latency by endpoint over the last 6 hours", "error count by service this week" - touches three or four of them.
- Aggregation-heavy. Almost nobody reads individual events. Queries scan millions or billions of rows and collapse them into a number, a percentile, or a time series.
This shape is close to a worst case for a row-oriented database. A row store lays each event down contiguously, so a query that needs 3 fields out of 200 still drags all 200 through the disk and page cache for every row it examines. It's also an awkward fit for an inverted-index search engine, which pays a heavy write and storage tax indexing every field so that any of them can be searched instantly - a capability aggregation queries barely use. What the shape is a perfect case for is a column store, and this is the entire trick: store each attribute in its own file, and a query reads only the files it names. Three columns out of 200 means touching around 1-2% of the bytes on disk before compression is even considered.
Compression: Sorted Columns Are Nearly Free to Store
Columnar layout does more than reduce what a query reads - it sets up the compression win, which is where most of the cost story lives.
Generic compression works by finding repetition. A row store gives the compressor almost nothing to work with: each block interleaves timestamps, strings, floats, and IDs, so patterns get diluted. A column file is the opposite - a long run of values of the same type, drawn from the same distribution. And because MergeTree physically sorts data by the table's ORDER BY key, a well-chosen sort order like (service_name, timestamp) means adjacent values aren't just similar, they're often identical: thousands of consecutive rows with the same service name, timestamps that increment by milliseconds, status codes that are 200 a hundred thousand times in a row.
On top of that layout, ClickHouse applies per-column encodings that exploit what each type looks like before general-purpose compression runs:
Delta/DoubleDeltastore the difference between consecutive values instead of the values - timestamps that tick up steadily collapse to near nothing.GorillaXORs consecutive floats, which zeroes out slowly-moving gauge metrics.LowCardinality(String)- a column type rather than a codec - dictionary-encodes repetitive strings like service names, log levels, and regions into small integers.ZSTDthen compresses whatever structure is left.
You don't have to take compression ratios on faith - ClickHouse will report them per column on your own data:
SELECT
    name,
    formatReadableSize(data_uncompressed_bytes) AS uncompressed,
    formatReadableSize(data_compressed_bytes)   AS compressed,
    round(data_uncompressed_bytes / data_compressed_bytes, 1) AS ratio
FROM system.columns
WHERE table = 'otel_logs'
ORDER BY data_uncompressed_bytes DESC;
Run that against a typical OpenTelemetry log table and the overall ratio usually lands around 10x with the default schema - ClickHouse's own ClickStack material quotes "at least 10x" for observability data, and their nginx log experiment pushed well past 50x once types and sort order were tuned. Sorted timestamps and low-cardinality columns compress far harder than the average; the free-text body column is what drags it down to merely "several times smaller than the raw data". The practical translation: a terabyte of raw logs per day becomes on the order of 100 GB of disk per day, and compression also feeds back into query speed, because a scan that reads 10x fewer bytes finishes correspondingly faster.
Skipping, Not Searching
The other half of the read path is what ClickHouse doesn't read. MergeTree keeps a sparse primary index - one entry per 8,192-row granule by default, not one per row - built from the ORDER BY key. A query filtered on service_name and a time range uses it to discard the vast majority of granules without touching them, then brute-force scans the survivors with a vectorized engine that processes values in CPU-friendly batches.
"Brute-force scan" sounds like the thing databases are supposed to avoid, and that instinct is exactly what ClickHouse inverts. Per-row index lookups are expensive to maintain and slow to aggregate over; scanning a compressed, sorted, columnar slice of exactly the data you asked about turns out to be fast enough that maintaining precise per-field indexes stops paying for itself. The engine does the coarse skip with the sparse index and wins the rest on raw scan throughput. How parts, granules, and the sort key fit together mechanically is its own topic - the MergeTree guide and our post on parts and merges go deep on it.
The Economics Are the Actual Argument
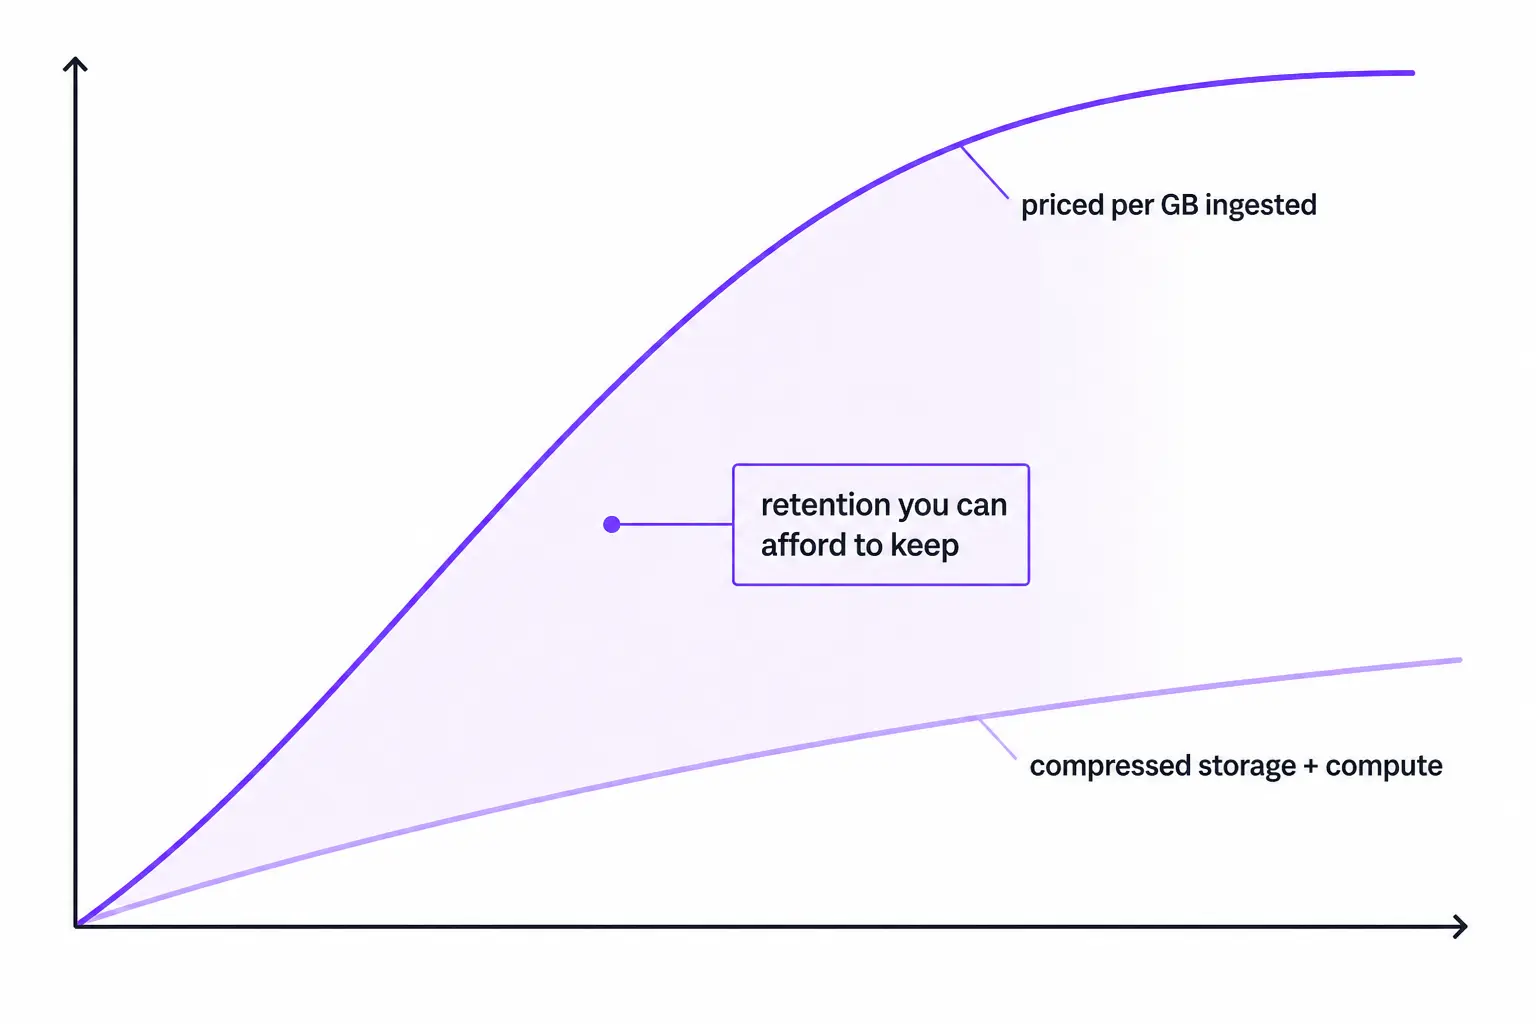
Engineers argue about architecture; migrations get approved over money. Traditional observability platforms price on data volume ingested - commonly tens of cents per GB, before per-host or per-user charges. At that price, telemetry growth converts directly into bill growth, and teams respond the only way they can: sample traces aggressively, drop debug logs, and cut retention to a week or two. At that point the pricing model, not the engineering team, is setting the observability strategy.
Self-hosted or usage-priced ClickHouse changes which number the bill tracks: compressed bytes stored plus compute, not raw bytes ingested. Combine object-storage-backed disks with a 10x compression ratio and retention stops being the first knob you reach for. Keeping 6 or 12 months of queryable history becomes an engineering decision instead of a budget concession - which matters most in exactly the situations observability exists for, like comparing this quarter's latency regression against how the system behaved before three deploys ago.
OpenTelemetry Made the Backend Swappable
One more ingredient explains the timing. Five years ago, choosing an observability backend meant committing to its agents, SDKs, and wire formats - the storage was bundled with the instrumentation, and switching meant re-instrumenting everything. OpenTelemetry broke that bundle. Instrumentation became a vendor-neutral standard, and the OTel Collector became the universal pipeline: it batches, buffers, transforms, and ships telemetry to whatever backend an exporter exists for.
The Collector's contrib distribution ships a ClickHouse exporter (beta for logs and traces), which reduces "adopt ClickHouse as an OpenTelemetry backend" to a config block:
exporters:
  clickhouse:
    endpoint: tcp://clickhouse:9000
    logs_table_name: otel_logs
    traces_table_name: otel_traces
    ttl: 720h
Once instrumentation is standardized and export is a config change, the backend competes on storage merit alone - and that's a competition tilted toward whichever engine handles wide, append-only, aggregation-heavy data best. The visualization layer is increasingly commodity too: Grafana speaks ClickHouse, and stacks like SigNoz and ClickStack package query UI and alerting on top of it.
Where ClickHouse Is the Wrong Answer
None of this makes ClickHouse a universal observability solution, and the failure modes are as architectural as the wins:
- Needle-in-a-haystack lookups. Fetching one specific event by ID means decompressing whole granules to find a single row. The sparse index that makes aggregations cheap makes point reads comparatively expensive.
- Search-first workflows. If your team's primary interaction with logs is typing free text into a search box and expecting ranked, fuzzy-matched results, an inverted-index engine is genuinely better at that job. We've written a full comparison in ClickHouse vs Elasticsearch for logs - the honest answer depends on your query pattern, not the migration trend.
- Small volumes. Under a few hundred gigabytes total, nearly anything works - Postgres, Loki, a hosted tier of anything. The columnar advantage compounds with scale; below that scale it mostly buys you operational homework.
- It's a database, not a product. ClickHouse gives you storage and a query engine. Dashboards, alerting, and retention policy are yours to assemble - and so is running the thing.
That last point is the one people skim past. Moving telemetry onto ClickHouse moves your observability stack's reliability onto a database you now operate: background merges competing for CPU, insert batching, part counts, disk headroom on an append-heavy workload. And the system you use to watch everything else has a way of becoming the thing nobody is watching. Our post on diagnosing high CPU and memory in ClickHouse covers what that firefighting looks like in practice.
That's the gap NeverBlink covers: it monitors the ClickHouse clusters themselves - merge pressure, part counts, insert throttling, query performance - and tells you which table or setting needs attention before your telemetry store becomes the outage. If your observability now runs on ClickHouse, ClickHouse is precisely the component you can't afford to be blind on.
The broader lesson isn't really about ClickHouse - it's that workload shape beats feature lists. Telemetry is wide, append-only, and aggregated, and a database built around sorted immutable columns keeps winning that workload for structural reasons, not fashionable ones. The teams at the top of this post never coordinated; the data made the same argument to each of them.