

There's a migration pattern showing up across observability teams right now: logs move out of Elasticsearch and into ClickHouse, storage bills drop severalfold, and dashboards that used to take ten seconds to load come back in one. Trip.com's engineering team documented moving a 50PB logging platform from Elasticsearch to ClickHouse and reported storage savings over 50% - enough to fit 4x the data volume on the same servers - with queries running 4 to 30 times faster. Didi's observability team cut hardware costs by 30% making the same move. These aren't outliers you'll struggle to reproduce - the underlying reasons are architectural, not lucky configuration.
None of that means Elasticsearch is on its way out, and treating this as "ClickHouse won, migrate everything" would be the wrong lesson. The two systems are built around different data structures for different jobs. Elasticsearch indexes text for retrieval and relevance. ClickHouse stores columns for aggregation and scanning. A lot of what gets labeled a "log analytics" workload is actually two workloads wearing the same trench coat - structured filtering and counting on one side, free-text search on the other - and the right database depends entirely on which one dominates your query traffic.
Two Different Data Structures, Two Different Strengths
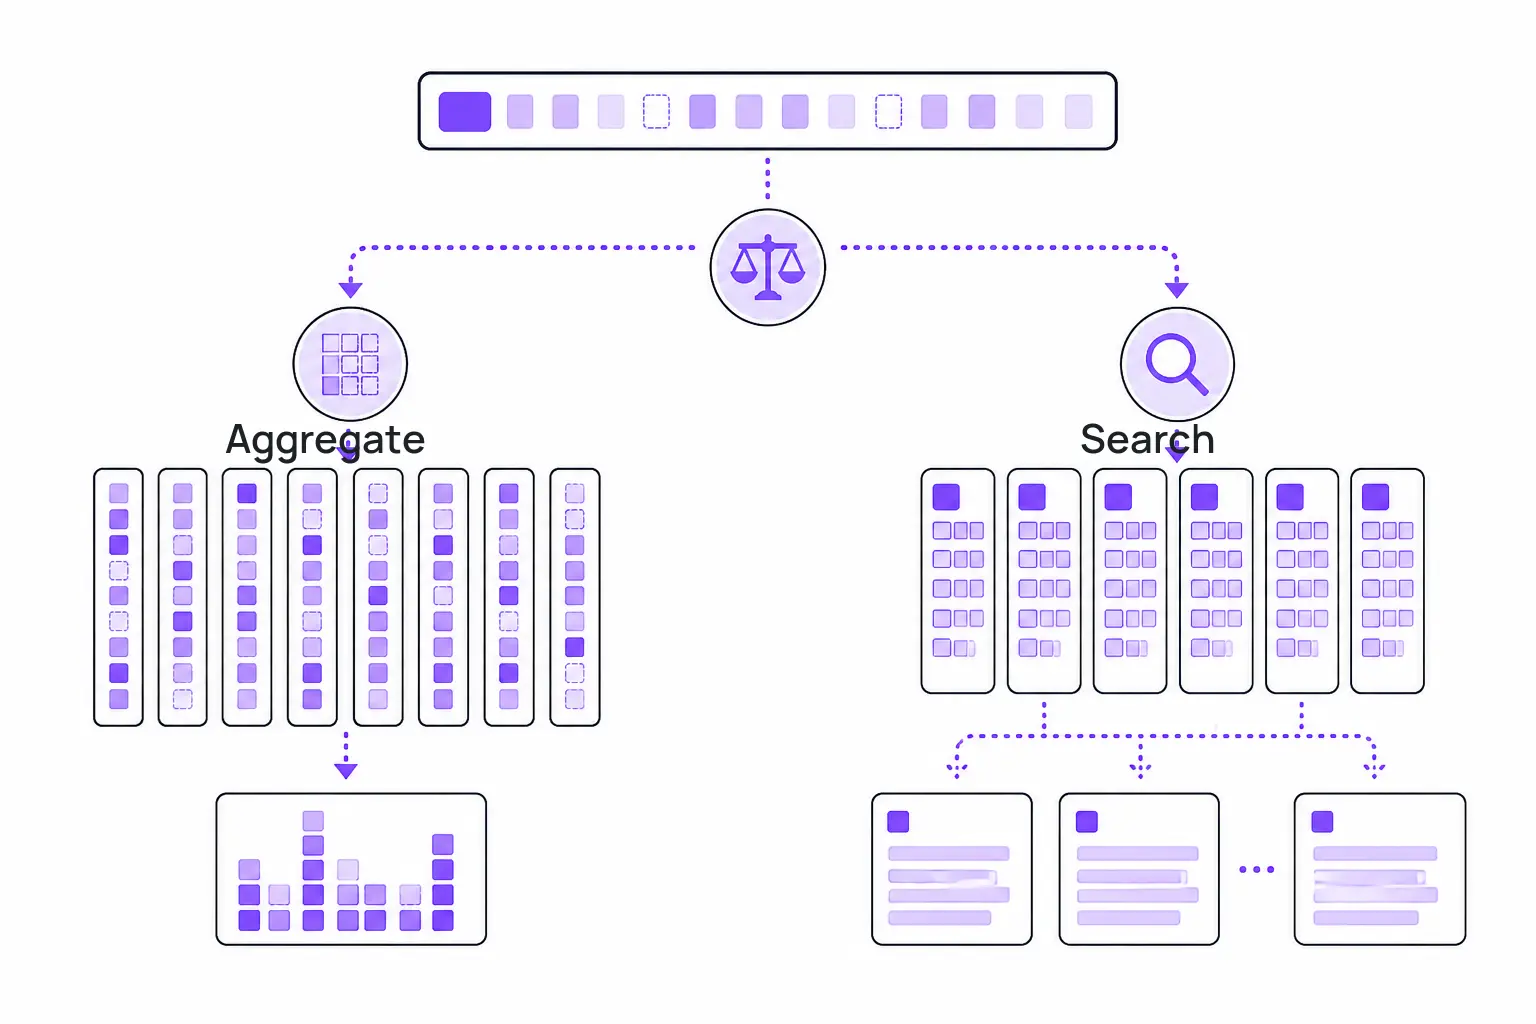
Elasticsearch is built on Lucene's inverted index: for every distinct token, it keeps a posting list of which documents contain it. That structure is what makes match "connection timeout" fast even across a billion documents, and it's what makes relevance scoring, fuzzy matching, and phrase proximity possible at all. ClickHouse is a columnar OLAP engine. Every column is stored, compressed, and scanned independently of the others, sorted by a primary key you choose at table creation. A GROUP BY service, status_code reads only those two columns off disk, not the whole row, and vectorized execution processes them in batches rather than one at a time.
Neither structure is "better" in the abstract. An inverted index is close to the wrong tool for computing p99 latency across a billion rows, and a columnar table is close to the wrong tool for finding every log line that fuzzy-matches "databse conection refused." The KB entry on ClickHouse vs Elasticsearch goes deeper into the mechanics; the short version is that the storage layout you pick determines what's cheap and what's expensive, and logs workloads usually contain both kinds of queries in different proportions.
The Storage Gap Is Real and It Compounds
This is where most of the migration motivation actually comes from. Elasticsearch's on-disk footprint for a log dataset is the sum of several structures held side by side: the inverted index, the stored _source JSON, and doc_values (the columnar structures Elasticsearch builds separately to support sorting and aggregations - effectively duplicating data it already tokenized). ClickHouse, storing genuinely columnar data with codecs like LZ4, ZSTD, Delta, and DoubleDelta chosen per column, hit 16x compression in ClickHouse's own billion-row OTel log benchmark - ending up with roughly one-fifth of the disk Elasticsearch needed for the identical dataset. Timestamps incrementing by milliseconds, status codes that are almost always 200 or 404, IP addresses clustered in a handful of subnets - these compress extremely well when the same field sits contiguously on disk instead of interleaved inside a JSON blob per document.
Multiply that gap across months of retention and the storage bill difference stops being rounding error. Less data on disk also means less I/O per query, which is a meaningful chunk of why ClickHouse aggregations over billions of rows come back in seconds rather than tens of seconds.
SQL vs a JSON DSL, Side by Side
The clearest way to see the difference is to write the same query twice. Say you want p95 latency per service for today's traffic. In ClickHouse:
SELECT
    service,
    quantile(0.95)(duration_ms) AS p95_latency,
    count() AS requests
FROM logs
WHERE event_date = today()
GROUP BY service
ORDER BY p95_latency DESC
Six lines, and anyone who's written SQL before can read it without documentation. The equivalent in Elasticsearch's query DSL:
{
  "size": 0,
  "query": {
    "range": { "@timestamp": { "gte": "now/d" } }
  },
  "aggs": {
    "by_service": {
      "terms": { "field": "service.keyword", "size": 500 },
      "aggs": {
        "p95_latency": {
          "percentiles": { "field": "duration_ms", "percents": [95] }
        }
      }
    }
  }
}
Roughly the same result, at more than double the line count, plus a detail that's easy to miss until it bites you: terms aggregations only return the top size buckets, so if you have more than 500 distinct services that day, some get silently dropped into sum_other_doc_count rather than raising an error. ClickHouse's GROUP BY doesn't have an equivalent cliff - it just returns every group.
Flip the query type, though, and the comparison inverts. Finding every request where the error message fuzzy-matches "databse conection" and ranking results by relevance is a match query away in Elasticsearch:
{
  "query": {
    "match": {
      "message": {
        "query": "database connection refused",
        "fuzziness": "AUTO"
      }
    }
  }
}
ClickHouse has no native equivalent. Its bloom-filter skip indexes (tokenbf_v1, ngrambf_v1) can accelerate exact-token and substring lookups, and ClickHouse's native full-text index - experimental since 23.1, GA as of 26.2 (March 2026) - handles token-based filtering well. But that index is a filter, not a relevance engine: no BM25 or TF-IDF scoring, no fuzzy matching, no synonym handling. If your query pattern is "rank these documents by how well they match this phrase," you're back in Elasticsearch's territory, full stop.
Operations: JVM Tuning vs Background Merges
The gap in daily operational load is just as real as the storage gap, and it's a separate reason teams migrate. Elasticsearch runs on the JVM, which means heap sizing is a permanent, non-optional concern: heap should stay under 50% of available RAM and, ideally, at or below the 26-30 GB range to avoid crossing the compressed object pointer threshold (Elasticsearch 8.x caps auto-configured heap at 31 GB specifically because of this). Cross that line and garbage collection pauses get long enough to knock a node out of the cluster. On top of that sits shard management - sizing shards in the 10-30 GB range for search or 30-50 GB for log-heavy write workloads, configuring Index Lifecycle Management to roll indices over by size or age, and cycling them through hot, warm, cold, and frozen tiers as they age. None of this is exotic, and plenty of teams run it well, but it's real, ongoing operational surface area.
ClickHouse's MergeTree engine handles compaction as a background process - small inserted parts merge into larger ones asynchronously, with no JVM heap to reason about. It's not operations-free (merge settings, memory limits per query, and replication via ClickHouse Keeper all need attention), but the tuning surface is smaller and the failure modes are more predictable. That difference in operational load, more than the storage number alone, is often what tips a team's decision once they've already committed to running one of these systems in production.
What This Actually Means for Your Stack
If your logs traffic is dominated by structured queries - count errors by service, break down status codes by endpoint, compute p95 latency over a rolling window, build a dashboard - that's aggregation work, and ClickHouse handles it faster, cheaper, and with less operational overhead. This describes the majority of observability query traffic at most companies: dashboards, alerting rules, and SLO tracking are almost entirely structured filters and counts, not free-text search.
If your workload is "find me the log lines that mention this error, ranked by how well they match, let me page through and drill in" - or you're running search-as-a-product, e-commerce search, or anything where relevance and recall quality matter to an end user - Elasticsearch or OpenSearch is still doing something ClickHouse can't replicate without building your own Lucene.
The common real-world answer for teams with both needs isn't to pick one and force-fit the other workload onto it. It's to route structured event data to ClickHouse for aggregation and dashboards, and keep a shorter-retention Elasticsearch or OpenSearch index for the subset of queries that need real full-text search over recent data. That split adds a small amount of pipeline coordination, but it avoids compromising either system's core strength - which is the trap that "just migrate everything" advice usually leads teams into.
Whichever side of that split you're running - or if you're running both - the operational cost doesn't disappear on its own. ClickHouse still needs sort keys chosen for your actual query patterns and merge settings tuned as data grows; Elasticsearch and OpenSearch still need shard sizing, heap headroom, and ILM policies that keep pace with retention changes. NeverBlink watches both kinds of clusters - Elasticsearch, OpenSearch, ClickHouse, and PostgreSQL - and surfaces the specific configuration or query change worth making, with the reasoning behind it. It doesn't apply changes automatically; it tells you what's wrong and why, and you decide what to run.