


top showing 1600% CPU on a ClickHouse box doesn't tell you much by itself, and that's the first thing to get straight before you start chasing the number. ClickHouse is built to drive an analytical query across every core it can get - a single SELECT scanning a few billion rows at 16 cores and change is doing exactly what it's supposed to. So the useful question is never "why is CPU high," it's "is this the CPU I expect, and if not, which of the three or four things that actually burn cycles and RAM on this engine is responsible." Memory pressure has the same shape: a query holding 8 GB mid-aggregation might be completely normal, or it might be one uniqExact away from tripping the server-wide memory tracker. This post walks through telling those apart using the system tables ClickHouse already gives you, rather than guessing from server load.
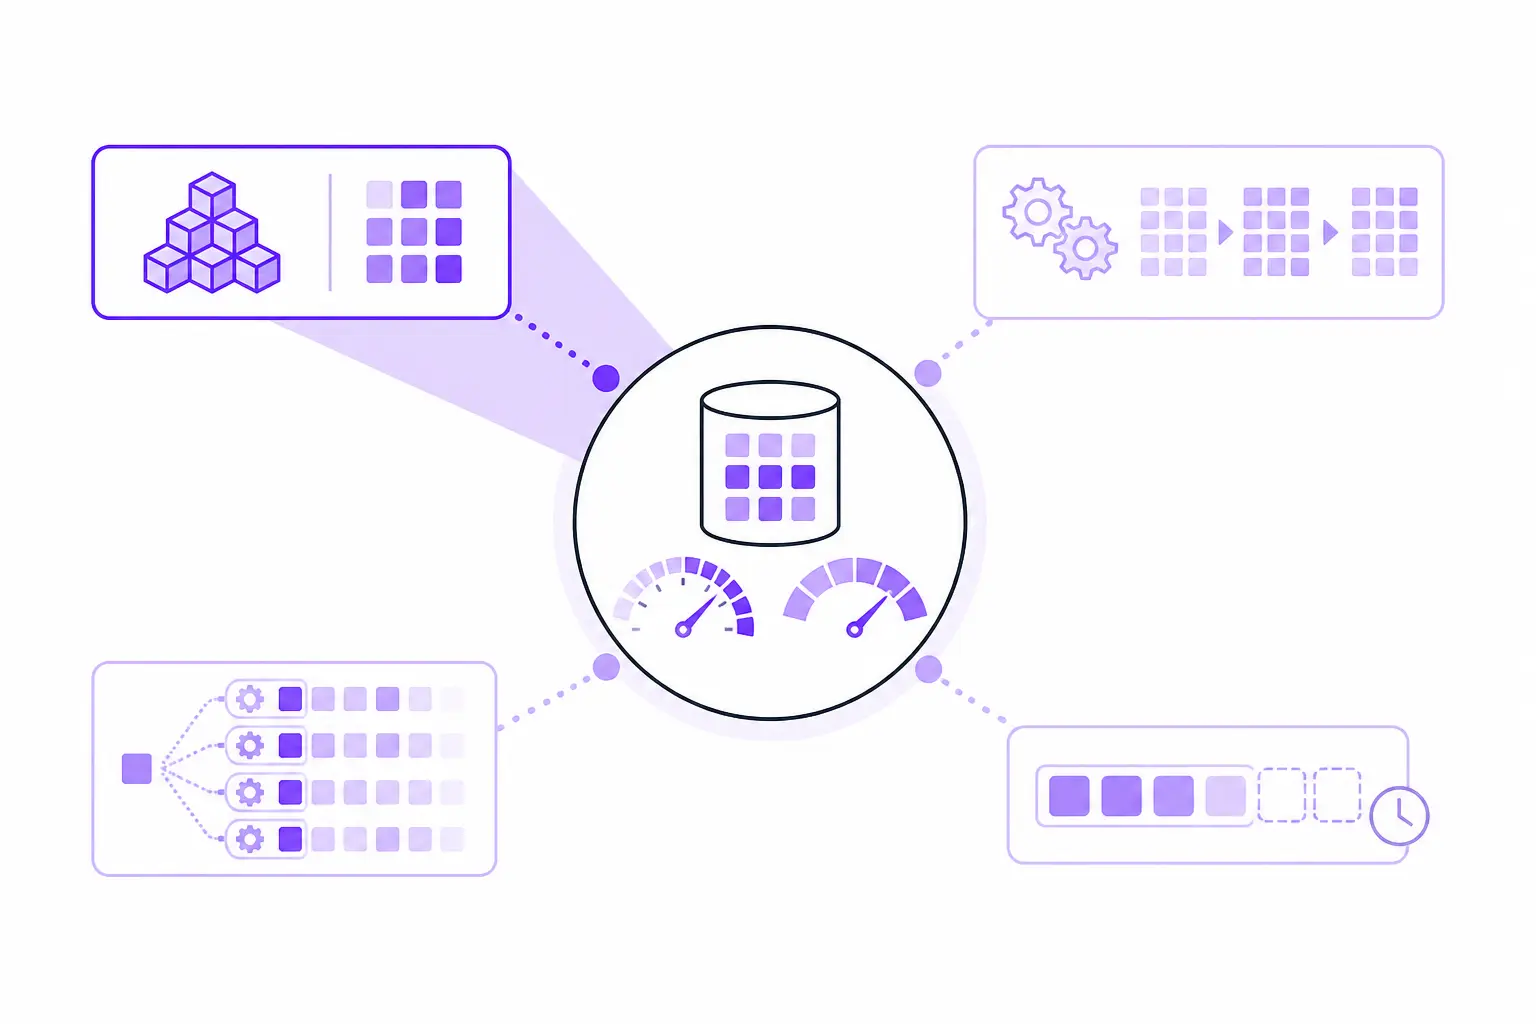
What's actually competing for the box
Four things drive sustained CPU or memory pressure on a ClickHouse node, and they call for different fixes.
Background merges. MergeTree writes a new part on every insert and continuously merges smaller parts into bigger ones in the background. You can't turn this off; merging is the write path, and a node under real ingest load will show multi-core CPU from merges even with zero queries running. The mechanics of parts and merges, plus the exact conditions that throttle inserts, are covered in depth in Inside ClickHouse MergeTree; the short version here is that merge pressure is one of the most common causes of "CPU is high and nothing is running," and it's the first thing to rule out before you go looking at queries.
Memory-bound aggregations and joins. GROUP BY and ORDER BY are blocking operators - ClickHouse has to accumulate a hash table or a sort buffer before it can emit a row. High-cardinality grouping keys, uniqExact instead of an approximate cardinality function, or an ORDER BY with no LIMIT can all build state that outgrows max_memory_usage and dies with MEMORY_LIMIT_EXCEEDED. Note that max_memory_usage defaults to 0 (unlimited) in self-managed installs, so the limit that actually fires is often the server-wide one - max_server_memory_usage_to_ram_ratio caps the whole process at 90% of RAM by default. Distributed aggregation makes this worse: the coordinator node holds the union of every shard's partial state, which can dwarf any single shard's local result.
Thread pool misconfiguration. max_threads controls how many lanes a single query gets, and it defaults to the visible core count. Set too low across a user profile, queries that should use every core run on one and take ten times longer than they need to. Left at default with enough concurrent queries, max_threads * concurrent queries can exceed max_thread_pool_size (10,000 globally) and start throwing CANNOT_SCHEDULE_TASK. Neither failure mode looks like the other in top - one shows low CPU with high load average, the other shows queries queuing and dying outright.
Everything outside the query and merge paths. ZooKeeper traffic on a wide replicated cluster, disk-tier data movement, or raw HTTP handler overhead from very high QPS of cheap queries. These matter less often but are worth ruling out last, because they're invisible to every query-focused check below.
The rest of this post is the order to check these in, and the actual queries to run.
Start with what's running right now
system.processes is the fastest check and the first stop. It shows every query executing at this instant:
SELECT
    query_id,
    user,
    elapsed,
    read_rows,
    formatReadableSize(memory_usage) AS mem,
    formatReadableSize(peak_memory_usage) AS peak,
    peak_threads_usage,
    substring(query, 1, 150) AS query
FROM system.processes
WHERE is_initial_query
ORDER BY elapsed DESC;
A single query running for tens of seconds with high peak_threads_usage and climbing memory_usage is often the whole story. Note the query_id - you'll want it for system.query_log once the query finishes, and you can end it directly if it's clearly wrong:
KILL QUERY WHERE query_id = '<id>';
KILL QUERY is cooperative, not immediate. A query stuck in a tight aggregation kernel can take a minute to actually exit, and that's expected, not a sign the kill failed.
If system.processes is empty and the box is still hot, the cause isn't a live query - move to merges next.
Rule out merges before you blame a query
SELECT
    database,
    table,
    elapsed,
    round(progress, 4) AS progress,
    is_mutation,
    formatReadableSize(total_size_bytes_compressed) AS size,
    formatReadableSize(memory_usage) AS mem
FROM system.merges
ORDER BY elapsed DESC;
If this table is consistently near capacity - background_pool_size (default 16) times background_merges_mutations_concurrency_ratio (default 2.0) rows - the merge pool is the bottleneck, not user queries. is_mutation = 1 means an ALTER TABLE ... UPDATE/DELETE is running through the same pool and can monopolize it for hours on a large table. Cross-check pool saturation directly:
SELECT metric, value
FROM system.metrics
WHERE metric IN ('BackgroundMergesAndMutationsPoolTask', 'BackgroundMergesAndMutationsPoolSize');
BackgroundMergesAndMutationsPoolTask sitting at the pool size ceiling confirms it. The ClickHouse high CPU diagnosis guide has the full walkthrough for correlating merges, mutations, and live queries when more than one is in play at once - useful when the picture isn't as clean as "it's just merges."
Memory: find out where it's actually going
Memory pressure needs a different first move than CPU, because system.processes.memory_usage only shows queries that are still running. If a query already failed with MEMORY_LIMIT_EXCEEDED, it's gone from that view. system.query_log keeps it:
SELECT
    event_time,
    type,
    query_id,
    user,
    formatReadableSize(memory_usage) AS mem,
    exception_code,
    substring(query, 1, 150) AS query
FROM system.query_log
WHERE type IN ('QueryFinish', 'ExceptionWhileProcessing')
  AND event_time >= now() - INTERVAL 1 DAY
ORDER BY memory_usage DESC
LIMIT 20;
Two details matter here. In system.query_log, memory_usage records the query's peak consumption over its whole run - unlike the live memory_usage in system.processes, which is the value at the instant you sampled. And the type filter has to include ExceptionWhileProcessing, because a query killed by the memory limit never writes a QueryFinish row; filter on QueryFinish alone and the exact queries you're hunting for are excluded. For a GROUP BY or ORDER BY specifically, ProfileEvents tells you whether the query spilled to disk or died trying:
SELECT
    query_id,
    event_time,
    formatReadableSize(memory_usage) AS mem,
    ProfileEvents['ExternalAggregationWritePart'] AS spill_writes,
    formatReadableSize(ProfileEvents['ExternalAggregationCompressedBytes']) AS spill_bytes,
    substring(query, 1, 150) AS query
FROM system.query_log
WHERE type = 'QueryFinish'
  AND ProfileEvents['ExternalAggregationWritePart'] > 0
  AND event_date >= today() - 1
ORDER BY ProfileEvents['ExternalAggregationCompressedBytes'] DESC
LIMIT 20;
A non-zero spill_writes means max_bytes_before_external_group_by is set and doing its job - the query is trading speed for surviving instead of dying. If a query failed outright with Code 241 and this shows zero, the spill threshold isn't configured at all, and that's usually the actual fix: set max_bytes_before_external_group_by to roughly half of max_memory_usage, and remember the merge phase needs nearly as much memory as the read phase, so max_memory_usage should end up at least double the spill threshold, not equal to it.
Two other categories are worth ruling out before assuming a query is the culprit. Primary keys held in memory for every active part:
SELECT database, table,
       formatReadableSize(sum(primary_key_bytes_in_memory_allocated)) AS pk_mem
FROM system.parts
WHERE active
GROUP BY database, table
ORDER BY sum(primary_key_bytes_in_memory_allocated) DESC
LIMIT 10;
And loaded dictionaries, which are pinned in RAM for as long as they're loaded:
SELECT database, name, type, formatReadableSize(bytes_allocated) AS bytes
FROM system.dictionaries
ORDER BY bytes_allocated DESC;
A hashed dictionary that's only queried occasionally is a candidate to switch to a cache layout so it stops occupying memory full-time. The memory usage diagnosis guide breaks down every category this way - caches, dictionaries, buffer tables, async insert buffers - which matters when RSS is high but no single query or dictionary explains all of it and you're chasing jemalloc slack instead of a leak.
Threading: too many cores or too few
This is the one that looks nothing like the others, because the symptom can be low CPU with high load average instead of a pegged core. Start by checking whether queries are actually using the parallelism you think they have:
SELECT
    normalizeQuery(query) AS pattern,
    count() AS occurrences,
    avg(query_duration_ms) AS avg_ms,
    avg(read_rows) AS avg_read_rows
FROM system.query_log
WHERE type = 'QueryFinish'
  AND event_time >= now() - INTERVAL 24 HOUR
  AND peak_threads_usage = 1
  AND query_kind = 'Select'
GROUP BY pattern
ORDER BY occurrences DESC
LIMIT 20;
If avg_read_rows is small (under roughly 163,840, the default merge_tree_min_rows_for_concurrent_read threshold), single-threaded execution is expected - ClickHouse doesn't bother parallelizing a scan that small. If avg_read_rows is large and the query is still running on one thread, something is capping it. Check what's actually configured:
SELECT name, value, default, changed
FROM system.settings
WHERE name IN ('max_threads', 'max_insert_threads', 'max_final_threads');
changed = 1 with value = 1 means a user profile is silently forcing single-threaded execution - easy to miss because nobody remembers setting it. EXPLAIN PIPELINE shows the planned parallelism before you even run the query, which is worth doing on any new query pattern before it ships:
EXPLAIN PIPELINE
SELECT count() FROM events WHERE event_date >= today() - 7;
A × 1 next to the read step means single-threaded, full stop - compare that against what you expected given the table size.
The opposite failure - too much parallelism - shows up as CANNOT_SCHEDULE_TASK under concurrent load. It happens when max_threads times the number of concurrent queries approaches max_thread_pool_size (10,000 by default):
SELECT metric, value
FROM system.metrics
WHERE metric IN ('GlobalThread', 'GlobalThreadActive', 'GlobalThreadScheduled');
GlobalThread climbing toward 10,000 is the warning sign before the exception actually fires. The fix isn't usually "raise the pool" - it's checking whether max_threads is unnecessarily high for queries that don't need it, or setting concurrent_threads_soft_limit_ratio_to_cores so parallelism degrades gracefully under load instead of every query grabbing the maximum. The concurrency and threading guide covers both failure modes with the full settings reference, including the background_pool_size gotcha where the setting silently does nothing if it's placed in a user profile instead of server config.
When none of the above explains it
If system.processes is empty, system.merges is quiet, and recent query_log entries are unremarkable, the CPU is going somewhere outside the normal query and merge paths. system.events is the place to look next - ZooKeeperTransactions for a chatty replicated cluster, OSReadBytes/OSWriteBytes for background data movement that bypasses the page cache, and system.moves if you suspect data shuffling between storage tiers. And if you need to go one level deeper than any system table, system.trace_log gives you an actual stack-sample profile for a specific query:
SET query_profiler_cpu_time_period_ns = 10000000;
-- run the query
SELECT trace_type, count(),
       arrayStringConcat(arrayMap(x -> demangle(addressToSymbol(x)), trace), '\n') AS stack
FROM system.trace_log
WHERE query_id = '<query_id>'
GROUP BY trace_type, trace
ORDER BY count() DESC
LIMIT 20;
That's the level where you can actually see which expression, aggregate function, or join algorithm is burning the cycles, rather than inferring it from duration and row counts.
None of this is a one-shot query you run once and file away. The categories above overlap in practice - a merge backlog competing with a memory-heavy aggregation for the same cores looks different minute to minute, and the query that spiked memory at 3 a.m. is long gone from system.processes by the time someone opens a dashboard. That's the gap NeverBlink is built for on ClickHouse: it samples system.query_log, system.merges, and the metrics tables continuously, so when something does spike, the correlation between merge pressure, a specific query's ProfileEvents, and thread pool saturation is already assembled instead of something you reconstruct by hand under time pressure. It surfaces the likely cause and the specific setting to change - max_bytes_before_external_group_by, background_pool_size, max_threads on a profile - and leaves the decision to apply it with you. Diagnosis is where the time actually goes; the fix, once you know what it is, is usually one line.