


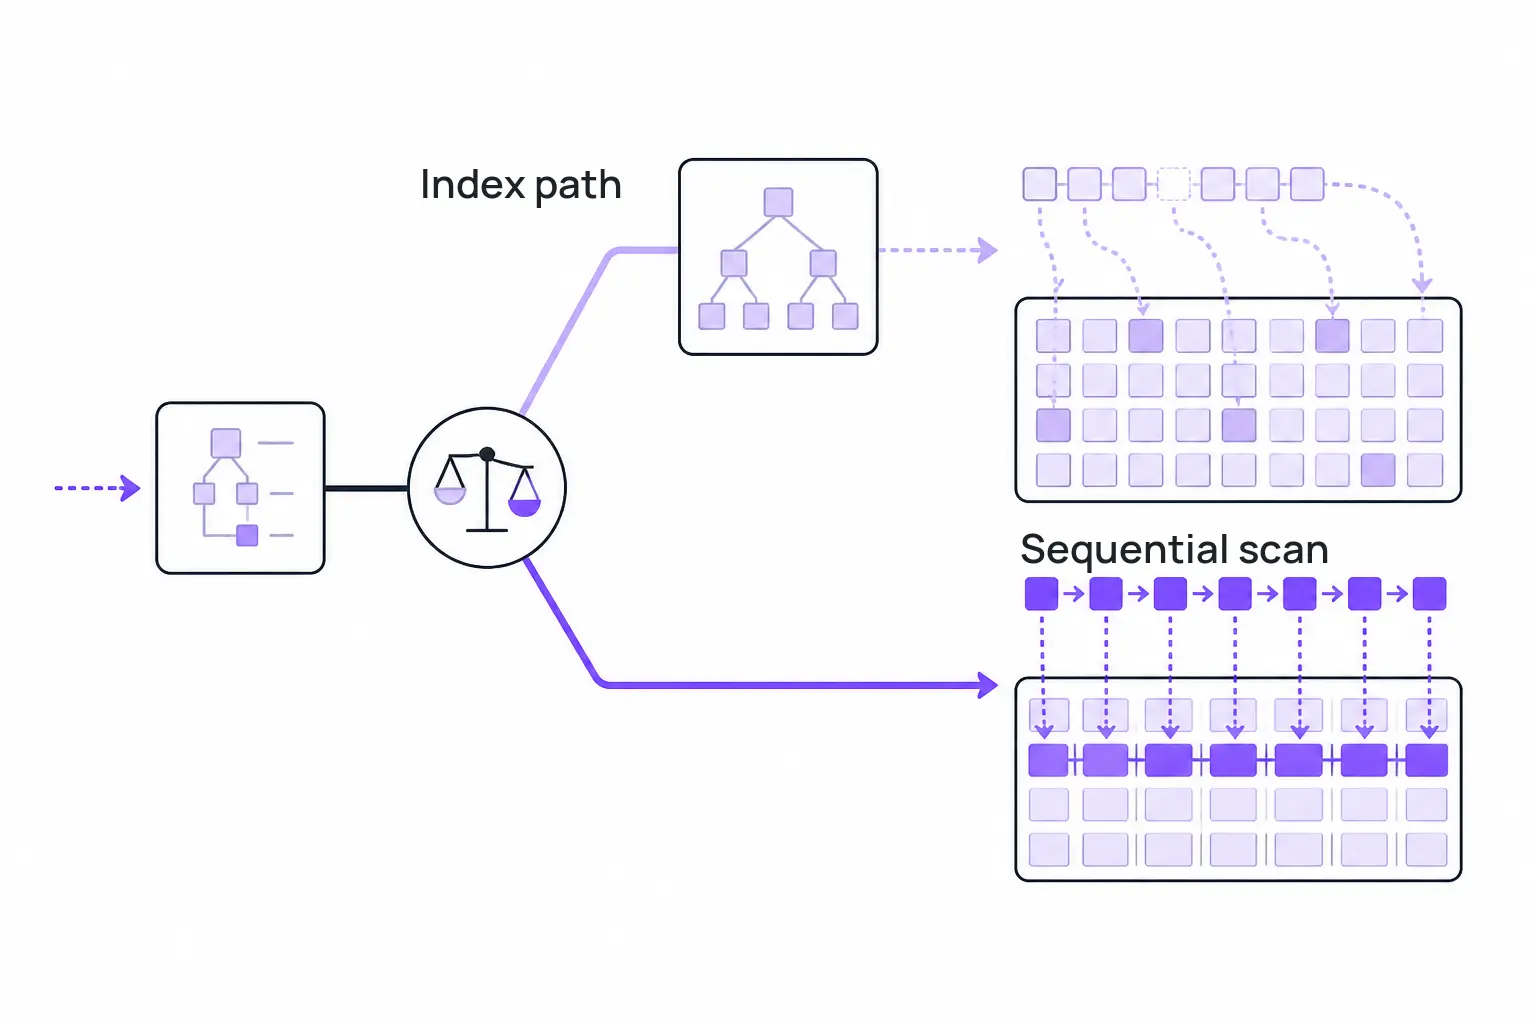
You add an index, run the query, and EXPLAIN still shows Seq Scan. The table isn't tiny, the column looks right, and yet Postgres walked past the index you built for exactly this query. This happens constantly, and it's rarely a bug: the planner picked the access path it estimated to be cheapest, with the information it had.
Every case collapses into one of two buckets. Either the planner thinks the index would be slower than the alternative, which is a cost-estimation problem you fix with statistics and configuration, or the index physically cannot answer the query as written, which is a structural mismatch you fix by rewriting the query or building a different index. We cover the short version of this list in the knowledge base; this post walks through it end to end against one table, with plans you can reproduce.
Set up the table:
CREATE TABLE orders (
    id serial PRIMARY KEY,
    customer_id int NOT NULL,
    status text NOT NULL,
    created_at timestamptz NOT NULL DEFAULT now(),
    total numeric(10,2) NOT NULL
);

-- 200,000 rows: status heavily skewed (completed 50%, pending 25%,
-- cancelled 22.5%, refunded 2.5%), customer_id spread across ~20,000 customers
INSERT INTO orders (customer_id, status, created_at, total)
SELECT (random() * 20000)::int,
       CASE WHEN i % 40 < 20 THEN 'completed'
            WHEN i % 40 < 30 THEN 'pending'
            WHEN i % 40 < 39 THEN 'cancelled'
            ELSE 'refunded' END,
       now() - (random() * interval '730 days'),
       (random() * 500)::numeric(10,2)
FROM generate_series(1, 200000) AS i;

CREATE INDEX orders_status_idx ON orders (status);
CREATE INDEX orders_customer_id_idx ON orders (customer_id);
ANALYZE orders;
If you haven't read plan output before, how to read EXPLAIN ANALYZE covers the cost notation and node types this post assumes.
The Planner Thinks the Index Is a Bad Bet
The table is small enough that it doesn't matter
Reference and lookup tables are the most common case people miss, because "small" doesn't feel like the problem when you're staring at a table with a perfectly good index on it.
CREATE TABLE order_statuses (
    id smallint PRIMARY KEY,
    code text NOT NULL,
    label text NOT NULL
);
INSERT INTO order_statuses VALUES
    (1, 'completed', 'Completed'), (2, 'pending', 'Pending'),
    (3, 'cancelled', 'Cancelled'), (4, 'refunded', 'Refunded');
CREATE INDEX order_statuses_code_idx ON order_statuses (code);

EXPLAIN ANALYZE SELECT * FROM order_statuses WHERE code = 'pending';
Seq Scan on order_statuses  (cost=0.00..1.05 rows=1 width=17) (actual time=0.008..0.010 rows=1 loops=1)
  Filter: (code = 'pending'::text)
  Rows Removed by Filter: 3
Planning Time: 0.062 ms
Execution Time: 0.028 ms
Four rows fit on one page. Reading that page sequentially costs one I/O; walking the index means a root-to-leaf descent through the B-tree plus a separate heap fetch for the match, which is more work. SET enable_seqscan = off; and re-run it if you want to see the index path's cost explicitly — it'll come back higher, and the planner was right the first time. This index isn't wasted; it'll start earning its keep once the table has thousands of rows instead of four.
The predicate isn't selective enough
An index pays off when it lets Postgres skip most of the table. When the predicate matches most of the table, the index scan ends up visiting nearly every heap page anyway, just in random order instead of sequential.
EXPLAIN ANALYZE SELECT * FROM orders WHERE status = 'completed';
Seq Scan on orders  (cost=0.00..4384.00 rows=100320 width=24) (actual time=0.019..38.442 rows=100000 loops=1)
  Filter: (status = 'completed'::text)
  Rows Removed by Filter: 100000
Planning Time: 0.118 ms
Execution Time: 44.201 ms
orders_status_idx exists and Postgres ignores it, correctly — half the table matches completed. If you regularly query the rare statuses, a partial index changes the math: CREATE INDEX orders_refunded_idx ON orders (created_at) WHERE status = 'refunded'; covers 2-3% of the table instead of the whole thing, and the planner will use it.
LIMIT skews the row-count math
Without an ORDER BY, LIMIT tells the planner it can stop as soon as it finds enough matching rows. For a Seq Scan, the expected number of rows to read before finding N matches is roughly (table_size / matching_rows) * N, which for a small N is cheap even without an index.
EXPLAIN ANALYZE SELECT id, customer_id FROM orders WHERE status = 'refunded' LIMIT 1;
Limit  (cost=0.00..0.87 rows=1 width=8) (actual time=0.014..0.015 rows=1 loops=1)
  ->  Seq Scan on orders  (cost=0.00..4384.00 rows=5040 width=8) (actual time=0.014..0.014 rows=1 loops=1)
        Filter: (status = 'refunded'::text)
Bump the LIMIT to something closer to how many refunded rows actually exist, and that math flips:
EXPLAIN ANALYZE SELECT id, customer_id FROM orders WHERE status = 'refunded' LIMIT 3000;
Limit  (cost=0.42..2413.76 rows=3000 width=8) (actual time=0.031..12.204 rows=3000 loops=1)
  ->  Index Scan using orders_status_idx on orders  (cost=0.42..4054.83 rows=5040 width=8) (actual time=0.030..11.680 rows=3000 loops=1)
        Index Cond: (status = 'refunded'::text)
Same table, same predicate, different plan — purely because the expected scan cost to satisfy the LIMIT crossed over. If a LIMIT query runs fine in testing and degrades as the matching set grows, this is usually why.
Statistics are stale
The planner's row estimates come from pg_statistic, which ANALYZE populates. A bulk load, a big DELETE, or a lopsided data migration can leave those estimates far from reality, and a bad estimate produces a bad cost comparison even when the index itself is fine.
DELETE FROM orders WHERE status = 'cancelled';  -- drops ~45,000 rows, no ANALYZE run after
EXPLAIN ANALYZE SELECT * FROM orders WHERE status = 'cancelled';
Postgres still assumes roughly the old cancelled-row count and may pick a plan sized for data that no longer exists. This is where the estimated rows= in a plan and the actual rows= diverge by 10x or more. Run ANALYZE orders; and re-check. If two columns are correlated in a way single-column statistics can't capture (region implying country, for instance), CREATE STATISTICS adds the multivariate estimate the planner is otherwise blind to.
random_page_cost doesn't match your storage
random_page_cost defaults to 4.0 against a seq_page_cost of 1.0 — a ratio calibrated for spinning disks, where a random seek really does cost several times a sequential read. SSD and NVMe don't have that penalty, so the default systematically overprices every index path on modern storage.
SET random_page_cost = 1.1;
EXPLAIN ANALYZE SELECT * FROM orders WHERE customer_id = 4821;
RESET random_page_cost;
If the plan flips to an index scan once you lower it, and your storage is SSD-backed, that's a legitimate case for changing it in postgresql.conf — after measuring, not as a reflex.
A better index already covers the query
Sometimes another index is simply a better fit for that particular query.
CREATE INDEX orders_customer_covering_idx ON orders (customer_id) INCLUDE (status, total);
EXPLAIN ANALYZE SELECT status, total FROM orders WHERE customer_id = 4821;
Index Only Scan using orders_customer_covering_idx on orders  (cost=0.42..4.53 rows=10 width=17) (actual time=0.021..0.024 rows=9 loops=1)
  Index Cond: (customer_id = 4821)
  Heap Fetches: 0
Planning Time: 0.145 ms
Execution Time: 0.041 ms
orders_customer_id_idx could serve this query too, but the covering index answers it without a heap fetch at all. Drop the covering index and Postgres falls back to the plain one with a small cost increase. Neither index is broken — check which one the plan actually names before assuming the one you expected is missing.
The Index Can't Answer the Query, Full Stop
No amount of cost tuning fixes these. The index is structurally unable to satisfy the query as written.
The predicate doesn't touch the index's leading columns
A composite index is a sorted structure on its columns in order. CREATE INDEX orders_status_created_idx ON orders (status, created_at); serves predicates on status, or on status and created_at together, but historically could not serve a predicate on created_at alone — the leading column was unconstrained, so the sort order didn't help.
PostgreSQL 18 changes this at the margins with skip scan: when the leading column has few distinct values, the planner can walk each distinct value of status and probe created_at within it, effectively running several small index scans instead of one big one. Look for Index Searches: N in the EXPLAIN (ANALYZE) output — a value greater than 1 on what looks like a single-condition plan is the tell that skip scan fired:
EXPLAIN (ANALYZE) SELECT * FROM orders WHERE created_at > now() - interval '1 day';
Index Scan using orders_status_created_idx on orders  (cost=0.42..612.10 rows=280 width=24) (actual time=0.041..2.203 rows=274 loops=1)
  Index Cond: (created_at > (now() - '1 day'::interval))
  Index Searches: 4
Four searches, one per distinct status value. This only pays off because status has low cardinality; on customer_id with 20,000 distinct values, skip scan degrades toward scanning the whole index anyway, and a plain sequential scan wins. Skip scan helps, but it doesn't replace putting the column you actually filter on first in the index.
A function wraps the column
EXPLAIN ANALYZE SELECT * FROM orders WHERE date_trunc('day', created_at) = '2026-08-01';
Seq Scan on orders  (cost=0.00..4884.00 rows=1000 width=24) (actual time=0.021..41.309 rows=274 loops=1)
  Filter: (date_trunc('day'::text, created_at) = '2026-08-01 00:00:00+00'::timestamp with time zone)
  Rows Removed by Filter: 199726
The index on created_at stores raw timestamps, not the output of date_trunc. Postgres doesn't try to prove the function is order-preserving and reason backward from it; it just can't use a plain index here. Rewrite the predicate as a range (created_at >= '2026-08-01' AND created_at < '2026-08-02'), which the existing index handles fine. If the rewrite isn't practical, build an expression index — with one catch on a timestamptz column: date_trunc('day', created_at) depends on the session's TimeZone setting, so it isn't immutable and CREATE INDEX rejects it. Pin the zone explicitly, CREATE INDEX orders_created_day_idx ON orders (date_trunc('day', created_at AT TIME ZONE 'UTC'));, and use the same expression in the query.
A data-type mismatch forces a cast
EXPLAIN ANALYZE SELECT * FROM orders WHERE customer_id = 4821::numeric;
Seq Scan on orders  (cost=0.00..4884.00 rows=10 width=24) (actual time=0.020..37.884 rows=9 loops=1)
  Filter: ((customer_id)::numeric = '4821'::numeric)
customer_id is int; casting the literal to numeric forces Postgres to cast every row's customer_id to compare, and the int index can't serve a numeric comparison. The Filter: line gives it away — the cast lands on the column side, (customer_id)::numeric, not the literal. Match the literal's type to the column instead of the other way around and the index comes back.
The operator isn't in the index's operator class
EXPLAIN ANALYZE SELECT * FROM orders WHERE status ILIKE 'Pending';
Seq Scan on orders  (cost=0.00..4384.00 rows=49730 width=24) (actual time=0.045..48.117 rows=50000 loops=1)
  Filter: (status ~~* 'Pending'::text)
  Rows Removed by Filter: 150000
A plain B-tree supports =, <, >, and BETWEEN; it can also serve left-anchored LIKE, but only under the C collation or with a text_pattern_ops index. ILIKE compiles to a case-insensitive pattern match (~~*) that the default B-tree operator class doesn't implement, so the index is simply not a candidate. Case-insensitive lookups need a lower(status) expression index paired with WHERE lower(status) = 'pending', or a trigram GIN index via pg_trgm if you also need substring or fuzzy matching.
Testing Without Guessing
EXPLAIN ANALYZE answers whether an index was used. SET enable_seqscan = off; (reset it after) forces the comparison and shows what the index path would have cost, which tells you whether the planner's choice was actually correct. Neither of those requires building anything.
To test a hypothetical index before paying to build it on a large table, the HypoPG extension creates one that exists only for the planner's benefit:
SELECT * FROM hypopg_create_index('CREATE INDEX ON orders (total)');
EXPLAIN SELECT * FROM orders WHERE total > 450;  -- plain EXPLAIN, not ANALYZE — nothing to execute against
If the estimated plan switches to the hypothetical index and the cost drops, building it for real is worth the write overhead and disk space. If it doesn't switch, you just saved yourself a CREATE INDEX on a multi-million-row table that wouldn't have helped.
This is also roughly what we built NeverBlink to do continuously rather than on demand: it watches plans from pg_stat_statements across your actual query traffic, catches the query that quietly regressed to a sequential scan after a stats drift or a data-type change, and traces it back to the specific cause. It recommends the fix — run ANALYZE, rewrite this predicate, add this expression index — rather than applying it, because a schema change that's right for one query can be wrong for the twenty others hitting the same table.
Most of the scenarios above have the same shape: the planner isn't broken, it's working from a cost model and a set of statistics that don't match reality anymore, or the query is asking the index to do something it structurally can't. EXPLAIN ANALYZE tells you which one you're looking at in under a second. Guessing takes considerably longer.