


"Just add an index" is the most common piece of PostgreSQL advice there is, and it's usually right. It's also usually offered without much explanation of what actually happens when you run CREATE INDEX. That gap matters the first time an index you added doesn't get used, or an index-only scan that should skip the table keeps hitting it anyway. Both of those are explainable once you know what's underneath - how rows sit on disk, what a B-tree page actually contains, and how the planner decides an index is worth using at all.
This post walks through that layer: table storage, why a sequential scan gets linearly worse, what a B-tree looks like once you stop picturing the textbook diagram, and how to read one directly with pageinspect.
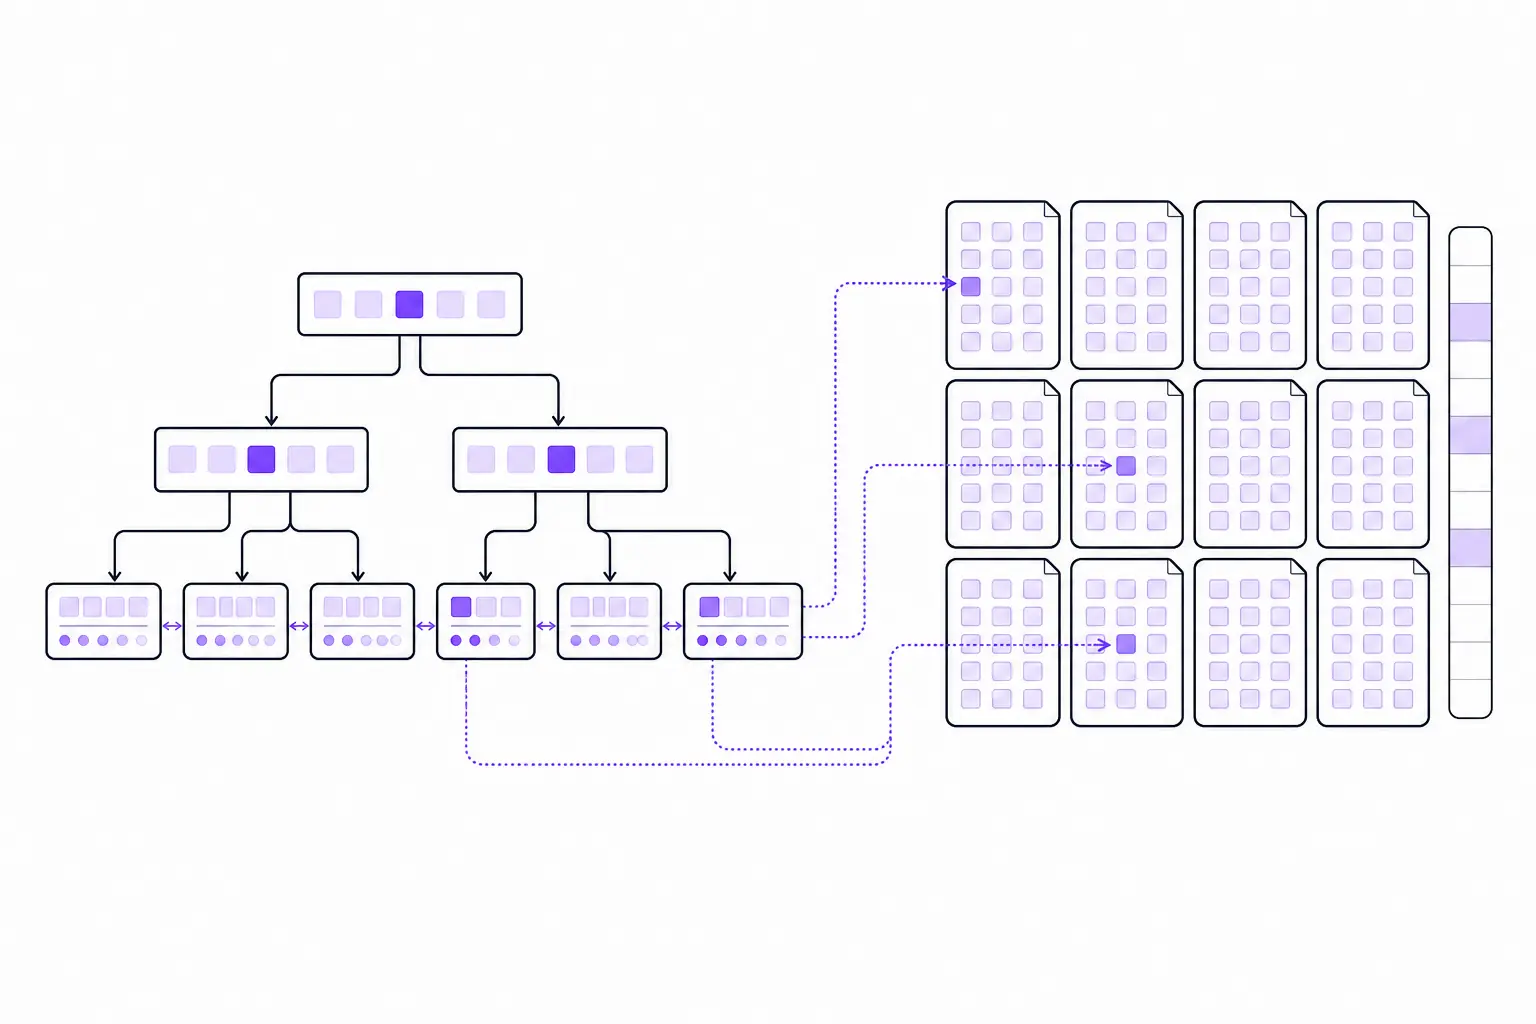
How a Table Actually Sits on Disk
A PostgreSQL table is a file (or a set of files, once it crosses 1 GB) broken into fixed-size pages, 8 KB by default. The engine never loads a whole table into memory to answer a query - it reads pages, one at a time, and every read and write operates at that granularity. Internally these pages are called blocks; the two words mean the same thing.
Each page has a 24-byte header holding pointers and housekeeping data, an array of line pointers that point at the actual rows, free space in the middle, and the rows themselves, packed in from the end of the page working backward. Every row - a heap tuple, in PostgreSQL's terms - has its own small header plus the column data. Two fields in that header matter more than the rest: t_xmin, the ID of the transaction that inserted the row, and t_xmax, the ID of the transaction that deleted or superseded it (zero if the row is still live). Every query runs against a snapshot, and the snapshot rules decide whether a given t_xmin/t_xmax pair makes a row visible to the current transaction - was the inserting transaction committed before this one started, is the deleting transaction still in flight, and so on. This is MVCC: instead of locking rows for reads, PostgreSQL keeps multiple versions around and lets each transaction see the version it's entitled to.
Every row also has a TID - a tuple identifier, which is just a (page number, line pointer) pair. It's the physical address of the row. Once something hands you a TID, finding the row costs one page read: no scanning, no searching, just a direct jump. That's the entire reason indexes work. An index doesn't store rows - it stores a sorted mapping from column values to TIDs. How PostgreSQL indexes work covers this storage layer in more depth, including how the visibility rules interact with index scans specifically.
Why a Sequential Scan Gets Expensive
Take SELECT * FROM orders WHERE id = 123 on a table with no usable index. PostgreSQL has no way to know in advance how many rows match, so it reads every page, checks every tuple's visibility, and evaluates the filter against each one. That's a sequential scan, and its cost is not a mystery - the planner computes it from a small set of constants: seq_page_cost (1.0 by default) per page read, plus cpu_tuple_cost (0.01) and cpu_operator_cost (0.0025) per tuple examined. Add those up across the table and you get the estimated cost you see at the top of an EXPLAIN plan.
The important property is that this cost is linear in table size. A query that scans a 10,000-row table in a few milliseconds will, on the same query and the same single matching row, take proportionally longer once that table hits ten million rows. Nothing about the query changed - only the amount of data standing between the engine and the answer. An index exists to break that linear relationship.
What a B-Tree Really Looks Like
btree is the default index type in PostgreSQL, and when people say "index" without qualification, this is almost always what they mean. It's a self-balancing tree that keeps entries sorted, which gives it search, insert, and delete in logarithmic time instead of the linear time a full scan requires.
Textbook B-tree diagrams usually show nodes with two or three children, and that picture is misleading for what actually runs in PostgreSQL. An index page is the same 8 KB as a heap page, and a sorted key plus a TID is small - often a few dozen bytes. That means a single internal page can hold hundreds of entries, not two or three. High fanout is the entire point: it keeps the tree shallow. A table with a few hundred million rows typically has a B-tree only three or four levels deep, so a lookup touches a handful of pages regardless of table size. That's where the logarithmic cost actually comes from - not from a tree that looks like a computer-science lecture slide, but from a tree that is extremely wide and barely tall.
Leaf pages hold the actual key/TID pairs and are linked to their siblings, so once a search lands on the right leaf it can walk sideways to pick up a range of matching values without going back up the tree. Page zero of the index file is reserved as a metapage, and it just points at the current root - useful to know when you start poking at an index with pageinspect, since that's the page you read first.
Inserting into a full page forces a split: the page divides in two, and a new separator key gets pushed up into the parent. If the parent is also full, the split cascades upward - which is why B-tree writes are cheap on average but occasionally spike when a cascade hits.
Column Order Isn't a Suggestion
A B-tree sorts by its columns in the order you declared them, and that order isn't cosmetic. Given:
CREATE INDEX idx_orders_status_created ON orders (status, created_at);
this index serves WHERE status = 'pending', and it serves WHERE status = 'pending' AND created_at > now() - interval '7 days'. It does not serve a query filtering on created_at alone - PostgreSQL can't binary-search a column that isn't the tree's leading key without first pinning down status. Sort order matters too: an index built ASC, ASC won't be used for ORDER BY status, created_at DESC unless a matching index with that direction exists, and reordering the requested columns (ORDER BY status, id, created_at against an index on status, created_at) breaks the match the same way. If you regularly see a composite index sitting unused in pg_stat_user_indexes, check whether the query's filter or sort order actually matches the leading columns before assuming the index is dead weight.
A related but different problem: a plain index only stores the indexed columns plus the TID. SELECT status, total_amount FROM orders WHERE status = 'pending' against an index on status alone still has to jump to the heap for total_amount, once per matching row. Adding it as a payload column avoids that:
CREATE INDEX idx_orders_status ON orders (status) INCLUDE (total_amount);
total_amount rides along in the leaf pages without being part of the sort key, which means it can't be searched or ordered on, but it can be read straight out of the index. PostgreSQL CREATE INDEX goes through the full set of options here - INCLUDE, partial indexes, expression indexes, and building without locking out writes with CONCURRENTLY.
The Visibility Map: Why "Index Only" Doesn't Always Mean It
Here's the part that trips people up even after they understand B-trees. An index entry stores a key and a TID - nothing else. No t_xmin, no t_xmax. So even with a covering index that has every column the query needs, PostgreSQL still has to answer one question before it can trust an entry: is this row actually visible to my transaction? Answering that from the index alone is impossible, because the visibility data doesn't live there.
The visibility map is what makes the index-only scan possible anyway. It's a compact per-table bitmap holding two bits per heap page; the one that matters here is the all-visible bit, set when every row on that page is visible to every transaction (in practice: nothing on the page has been touched since the last vacuum cleaned it up; the other bit tracks whether the page is all-frozen). During an index-only scan, PostgreSQL checks the all-visible bit for the heap page a matching TID points at. Bit set - skip the heap entirely, return the value straight from the index. Bit unset - fall back to a heap fetch to check t_xmin/t_xmax the normal way, on that one row.
The map only gets refreshed by VACUUM. A table that's had heavy recent write traffic and hasn't been vacuumed since will show heap fetches in EXPLAIN (ANALYZE, BUFFERS) even against a textbook-perfect covering index, and the query runs closer to a regular index scan than an index-only one. If autovacuum is falling behind - a table's churn outpacing it, autovacuum settings too conservative, a long-running transaction pinning the horizon - this is one of the places that shows up as a silent regression: nothing about the index or the query changed, but the heap-fetch count on an "index-only" scan starts climbing anyway.
Reading an Index With pageinspect
Everything above is describable in the abstract, but PostgreSQL ships an extension that lets you look at it directly:
CREATE EXTENSION IF NOT EXISTS pageinspect;
Start at the metapage to see how tall the tree actually is:
SELECT * FROM bt_metap('orders_pkey');
The level and fastlevel columns tell you the height, and root gives you the block number to start from. A tree three or four levels deep on a table with tens of millions of rows is normal - if you see something dramatically taller, that's usually a sign of long-standing bloat that hasn't been reclaimed.
From there, pull stats on any individual page:
SELECT * FROM bt_page_stats('orders_pkey', 1);
This returns live and dead item counts, average item size, and free space on that page - a direct look at how tightly packed a leaf page is and whether dead entries (left behind by updates and deletes until vacuum or a bottom-up index deletion clears them) are eating into it. And you can go one level further and read the raw items on a page:
SELECT itemoffset, ctid, itemlen, data
FROM bt_page_items('orders_pkey', 1)
LIMIT 5;
ctid here is the TID the entry points back to in the heap - the thing this whole structure exists to produce efficiently. None of this is something you'd run routinely against a production index, but it's the fastest way to confirm what's actually on disk when a plan looks wrong and the usual EXPLAIN output doesn't explain enough.
That gap - between a plan that looks fine and a query that quietly got slower anyway - is exactly the kind of thing that's tedious to catch by hand and easy to automate the watching for. NeverBlink tracks PostgreSQL query plans, index usage, and vacuum/visibility-map health continuously, and when something like an index-only scan starts falling back to the heap, it surfaces the specific cause rather than just the symptom. It doesn't apply changes on its own - the recommendation goes to whoever owns the database, and they decide what to run.
The mental model is worth having even if you never run pageinspect against a production system. Once you know a B-tree is a wide, shallow tree of 8 KB pages, that an index entry carries no visibility information of its own, and that the planner is picking between plans using a handful of published cost constants, most of what EXPLAIN shows you stops looking like a black box.